Labels
The axes of the RadChart display a label for each of the major ticks
You can specify custom Axis Items Labels by either specifying a XCategory or by manually setting TickPoint's labels.
XCategory is used when the data is not sequential, i.e. values on the X Axis have no meaning, for examle when the chart presents information for different companies (whose names are placed on the X axis) or other entities. In case X value is present in the data, and something else should be placed on the X axis, you need to go through the RadChart.DefaultView.ChartArea.AxisX.TickPoints collection and set Label for each TickPoint. Since the XCategory is already described in another help article - Categorical Charts this topic will demonstrate the second approach:
DataSeries lineSeries = new DataSeries();
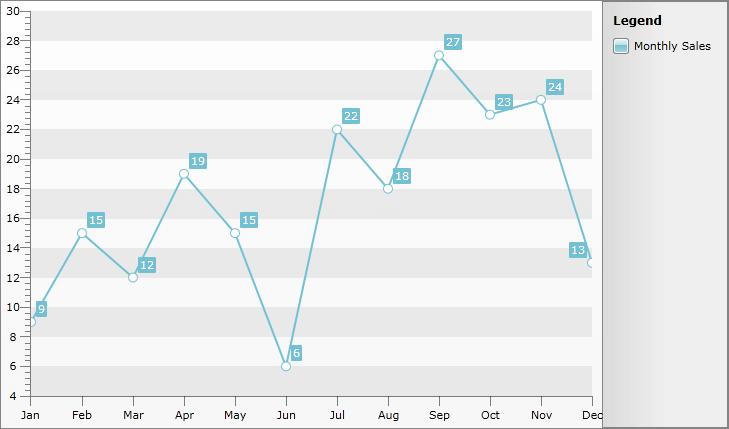
lineSeries.LegendLabel = "Monthly Sales";
lineSeries.Definition = new LineSeriesDefinition();
Random r = new Random();
for (int i = 0; i < 12; i++)
{
lineSeries.Add(new DataPoint() { YValue = i + r.Next(0, 20) });
}
this.radChart.DefaultView.ChartArea.DataSeries.Add(lineSeries);
string[] months = new string[] { "Jan", "Feb", "Mar", "Apr", "May", "Jun", "Jul", "Aug", "Sep", "Oct", "Nov", "Dec", };
for (int i = 0; i < months.Length; i++)
{
this.radChart.DefaultView.ChartArea.AxisX.TickPoints[i].Label = months[i];
}The result is: