New to Telerik UI for WinForms? Start a free 30-day trial
How to Plot Error Bars (x-y) on a Scatter Plot
Updated over 1 year ago
Environment
| Product Version | Product | Author |
|---|---|---|
| 2021.1.122 | RadChartView for WinForms | Desislava Yordanova |
Description
This tutorial demonstrates a sample approach how to achieve scatter plots with error bars.
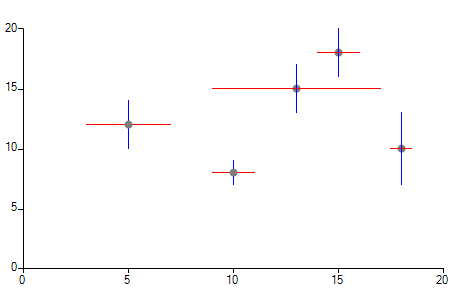
Solution
It will be necessary to use a custom renderer. Besides a custom renderer, it is necessary to create special scatter data points holding information about the deviations along the X and Y axes. Last, but not least, we will create a custom ScatterErrorBarsDrawPart where the actual rendering is being executed:
RadChartView's setup
C#
 public Form1()
{
    InitializeComponent();

    this.radChartView1.CreateRenderer += radChartView1_CreateRenderer;

    ScatterSeries scatterSeries = new ScatterSeries();
    scatterSeries.Name = "";
    scatterSeries.DataPoints.Add(new ScatterErrorBarsDataPoint(15, 18, 1, 2));
    scatterSeries.DataPoints.Add(new ScatterErrorBarsDataPoint(18, 10, 0.5, 3));
    scatterSeries.DataPoints.Add(new ScatterErrorBarsDataPoint(13, 15, 4, 2));
    scatterSeries.DataPoints.Add(new ScatterErrorBarsDataPoint(10, 8, 1, 1));
    scatterSeries.DataPoints.Add(new ScatterErrorBarsDataPoint(5, 12, 2, 2));

    scatterSeries.PointSize = new SizeF(8, 8);
    this.radChartView1.Series.Add(scatterSeries);
}

private void radChartView1_CreateRenderer(object sender, ChartViewCreateRendererEventArgs e)
{
    e.Renderer = new ScatterErrorBarsCartesianRenderer(e.Area as CartesianArea);
}
Custom renderer
C#
public class ScatterErrorBarsCartesianRenderer : CartesianRenderer
{

    public ScatterErrorBarsCartesianRenderer(CartesianArea area)
        : base(area)
    { }

    protected override void Initialize()
    {
        base.Initialize();

        for (int i = 0; i < this.DrawParts.Count; i++)
        {
            ScatterSeriesDrawPart scatterPart = this.DrawParts[i] as ScatterSeriesDrawPart;
            if (scatterPart != null)
            {
                this.DrawParts[i] = new ScatterErrorBarsDrawPart((ScatterSeries)scatterPart.Element, this);
            }
        }
    }
}
Custom ScatterErrorBarsDataPoint
C#
public class ScatterErrorBarsDataPoint : ScatterDataPoint
{
    private double? dx;
    private double? dy;

    public ScatterErrorBarsDataPoint(double x, double y, double dx, double dy)
        : base(x, y)
    {
        this.DeltaX = dx;
        this.DeltaY = dy;
    }

    public double? DeltaX
    {
        get
        {
            return this.dx;
        }
        set
        {
            this.dx = value;
        }
    }

    public double? DeltaY
    {
        get
        {
            return this.dy;
        }
        set
        {
            this.dy = value;
        }
    }
}
Custom ScatterErrorBarsDrawPart
C#
public class ScatterErrorBarsDrawPart : ScatterSeriesDrawPart
{
    public ScatterErrorBarsDrawPart(ScatterSeries series, IChartRenderer renderer)
        : base(series, renderer)
    {
    }

    public override void DrawSeriesParts()
    {
        PointF[] points = this.GetPointsPositionsArray();

        if (points == null)
        {
            return;
        }

        RadGdiGraphics radGraphics = new RadGdiGraphics(this.Renderer.Surface as Graphics);
        List<DataPointElement> pointElements = new List<DataPointElement>();
        DataPointElementLayoutSlotComparer comparer = new DataPointElementLayoutSlotComparer();

        if (this.Renderer is CartesianRenderer)
        {
            comparer.Vertical = ((CartesianRenderer)this.Renderer).Area.Orientation == Orientation.Vertical;
        }

        comparer.Collection = this.Element.DataPoints;

        for (int i = 0; i < this.Element.Children.Count; i++)
        {
            DataPointElement pointElement = this.Element.Children[i] as DataPointElement;
            int index = pointElements.BinarySearch(pointElement, comparer);
            pointElements.Insert(~index, pointElement);
        }

        for (int i = 0; i < pointElements.Count; i++)
        {
            DataPointElement childElement = pointElements[i];

            if (childElement == null || !childElement.IsVisible || childElement.PointSize.Width < 1f ||
                childElement.PointSize.Height < 1f)
            {
                continue;
            }

            SizeF pointSize = childElement.PointSize;
            PointF pointLocation = points[i];

            RectangleF ptRect = new RectangleF(pointLocation, pointSize);
            ptRect.Offset(pointSize.Width / -2f, pointSize.Height / -2f);

            if (childElement.BackgroundShape != null)
            {
                childElement.BackgroundShape.Paint((Graphics)radGraphics.UnderlayGraphics, ptRect);
            }


            GraphicsPath pointPath = null;

            if (childElement.Shape != null)
            {
                pointPath = childElement.Shape.CreatePath(ptRect);
            }
            else
            {
                pointPath = new GraphicsPath();
                pointPath.AddEllipse(ptRect);
            }

            if (pointPath != null)
            {
                // Paint the data point
                FillPrimitiveImpl pointFill = new FillPrimitiveImpl(childElement, null);
                pointFill.PaintFill(radGraphics, pointPath, ptRect);

                BorderPrimitiveImpl pointBorder = new BorderPrimitiveImpl(childElement, null);
                pointBorder.PaintBorder(radGraphics, null, pointPath, ptRect);

                if (childElement.Image != null)
                {
                    ImagePrimitiveImpl pointImage = new ImagePrimitiveImpl(childElement);
                    pointImage.PaintImage(radGraphics, childElement.Image, ptRect, childElement.ImageLayout,
                        childElement.ImageAlignment, childElement.ImageOpacity, false);
                }

                pointPath.Dispose();


                NumericalAxis xAxis = (NumericalAxis)this.Element.Axes[0];
                NumericalAxis yAxis = (NumericalAxis)this.Element.Axes[1];
                ScatterErrorBarsDataPoint dataPoint = (ScatterErrorBarsDataPoint)childElement.DataPoint;

                // Paint the X deviation
                if (dataPoint.DeltaX.HasValue)
                {
                    double delta = xAxis.ActualRange.Maximum - xAxis.ActualRange.Minimum;
                    double x = this.OffsetX + xAxis.Model.LayoutSlot.X;

                    double min = dataPoint.XValue - dataPoint.DeltaX.Value;
                    double normalizedMinValue = (min - xAxis.ActualRange.Minimum) / delta;
                    double x1 = x + normalizedMinValue * xAxis.Model.LayoutSlot.Width;

                    double max = dataPoint.XValue + dataPoint.DeltaX.Value;
                    double normalizedMaxValue = (max - xAxis.ActualRange.Minimum) / delta;
                    double x2 = x + normalizedMaxValue * xAxis.Model.LayoutSlot.Width;

                    radGraphics.DrawLine(Color.Red, (float)x1, (float)dataPoint.LayoutSlot.Y + this.OffsetY,
                        (float)x2, (float)dataPoint.LayoutSlot.Y + this.OffsetY, 1);
                }

                // Paint the Y deviation
                if (dataPoint.YValue.HasValue && dataPoint.DeltaY.HasValue)
                {
                    double delta = yAxis.ActualRange.Maximum - yAxis.ActualRange.Minimum;
                    double y = this.OffsetY + yAxis.Model.LayoutSlot.Y;

                    double min = dataPoint.YValue.Value - dataPoint.DeltaY.Value;
                    double normalizedMinValue = 1 - (min - yAxis.ActualRange.Minimum) / delta;
                    double y1 = y + normalizedMinValue * yAxis.Model.LayoutSlot.Height;

                    double max = dataPoint.YValue.Value + dataPoint.DeltaY.Value;
                    double normalizedMaxValue = 1 - (max - yAxis.ActualRange.Minimum) / delta;
                    double y2 = y + normalizedMaxValue * yAxis.Model.LayoutSlot.Height;

                    radGraphics.DrawLine(Color.Blue, (float)dataPoint.LayoutSlot.X + this.OffsetX, (float)y1,
                        (float)dataPoint.LayoutSlot.X + this.OffsetX, (float)y2, 1);
                }
            }
        }
    }
}