Spline Charts
Spline charts allow you to take a limited set of known data points and approximate intervening values. In practice you define a series of chart items with X/Y values and RadChart does the rest.
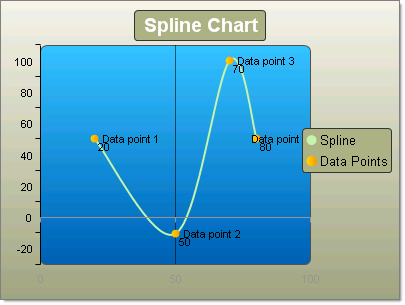
To create a simple vertical Spline Chart set the SeriesOrientation property to Vertical. Set the RadChart DefaultType property or ChartSeries.Type to Spline. Create a series and add chart items with Y or X and Y values.
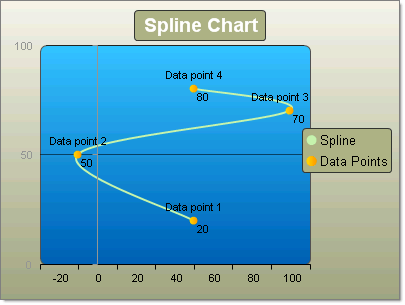
To create a simple horizontal Spline Chart set the SeriesOrientation property to Horizontal. Set the RadChart DefaultType property or ChartSeries.Type to Spline. Create a series and add 3 or more chart items with X and Y values.
| YValue | XValue |
|---|---|
| 20 | 50 |
| 50 | -10 |
| 70 | 100 |
| 80 | 50 |
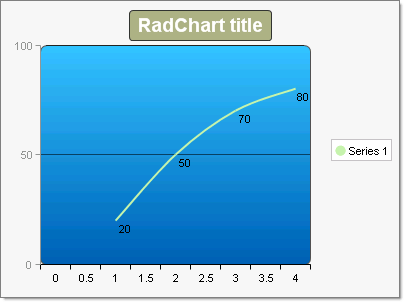
Another example showing the same Y data points as above, but with no X values defined displays an automatic even progression over the X axis.
| YValue |
|---|
| 20 |
| 50 |
| 70 |
| 80 |