CandleStick Charts
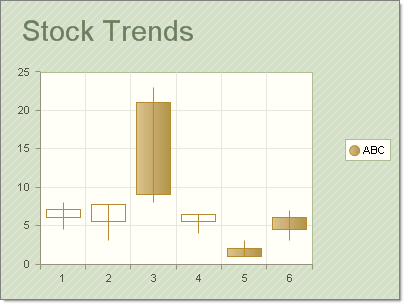
The CandleStick chart combines bar and line chart styles to show a range of value movement over time. A filled bar indicates the opening value was greater than the closing value. An empty bar indicates that the closing value was greater than the opening value. The line through the center (the "wick") shows the extreme high and low values. The meaning of the Y values in a CandleStick chart are:
-
YValue = Open
-
YValue2 = Close
-
YValue 3 = Max
-
YValue 4 = Min
The "bar" portion of each chart item is formed between the YValue and YValue2 properties. The "wick" portion of the chart is defined with the YValue3 and YValue4 chart item properties.
To create a Vertical CandleStick Chart set the SeriesOrientation property to Vertical. Set the RadChart DefaultType property or ChartSeries.Type to CandleStick.
To create a Vertical CandleStick Chart set the SeriesOrientation property to Horizontal. Set the RadChart DefaultType property or ChartSeries.Type to CandleStick.
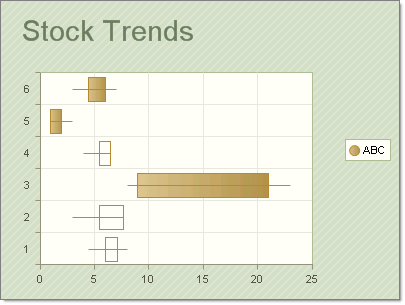
The screenshots above use the following data points:
| YValue | YValue2 | YValue3 | YValue4 |
|---|---|---|---|
| 6 | 7.1 | 4.5 | 8 |
| 5.5 | 7.7 | 3 | 6 |
| 21 | 9 | 8 | 23 |
| 5.5 | 6.5 | 4 | 6.5 |
| 6 | 4.5 | 3 | 7 |