Kendo UI for jQuery Chart Overview
Updated on Dec 10, 2025
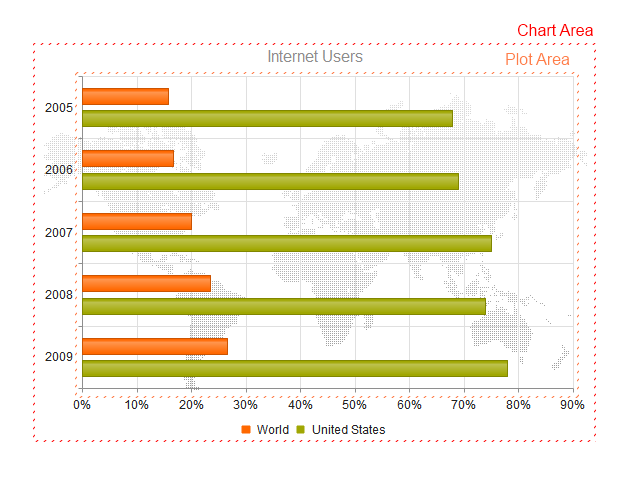
The Kendo UI Chart uses modern browser technologies to render high-quality data visualizations.
All graphics are rendered on the client by using Scalable Vector Graphics (SVG) with a fallback to Canvas. The Charts support a set of series types such as Bar, Line, Area, Bullet, Pie, Scatter, Bubble, Polar, and other.
Functionality and Features
| Feature | Definition |
|---|---|
| Data binding | You can populate the Kendo UI Chart with data. |
| Export | The Chart enables you to export their content to PDF, SVG, or Image files. |
| Appearance | You can control the appearance of the Chart elements by using JavaScript style options. |
| Axes | The Chart enables you to configure its axes. |
| Data series | The Chart enables you to plot one or more data series of a specified type. |
| Date series | You can control the display of dates in the Kendo UI Chart. |
| Error bars | The Chart enables you to implement error bars which show the variability of data. |
| Legend | The Chart legend displays the name of the configured data series. |
| Notes | The Chart enables you to display the metadata of a point or a specific part of the axis. |
| Panes | The Chart panes enable you to create vertical sub-divisions in a single categorical Chart. |
| Title | The Chart enables you to configure its title. |
| Tooltip | The Chart enables you to display details about the data point over which the mouse is currently hovering. |
| No Data Template | The Chart allows you to show an overlay with a "No Data Available" message when there's no data in the component. |
Next Steps
- Getting Started with the Kendo UI Chart for jQuery
- Basic Usage of the Chart (Demo)
- JavaScript API Reference of the Chart