Infographics

What’s the Best and Easiest Way to Embed Data Reporting into My Application? …and enable my end-users to create ad-hoc visuals on their own
Let’s explore what are the possible options for a developer to implement reporting functionality into their web or desktop applications. This decision can impact team productivity and the application quality, among other factors.
We put into the spotlight the two most common ways to solve the need for reporting capabilities into your application: Building a reporting functionality in-house or buying a third-party embedded reporting solution. We will explore the multiple questions you need to ask yourself while following the road and the possible answers to those.
For an in-depth discussion and expert recommendations on successful integration between reporting tools and web and desktop applications, check out this FREE ebook.

What’s the Best Way to Build Your Web Application?
This decision can be boiled down to two main approaches: building your own components or buying a third-party UI library. We’ll explore the implications of each well-trodden path in eight reality-inspired categories: Ticking off all project checkboxes; UI library documentation; Technical support; External dependencies; Software updates; Component reusability; Money and return on investment; The pleasure factor.
For an in-depth discussion on deciding whether to build your UI in-house or implement an external solution, check out the article linked here.
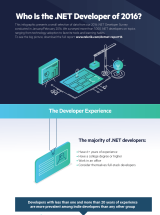
Who is the .NET Developer of 2016?
To see the full picture, download our survey report and enjoy the insightful commentary of our developer advocates John Bristowe, Sam Basu and Ed Charbeneau. You can also read our previous posts covering the survey.
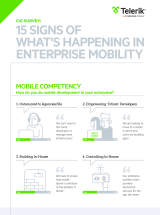
15 Signs of What's Happening in Enterprise Mobility
Have a look at the “CIO Survey, 15 Signs of What’s Happening in Enterprise Mobility,” to learn about the challenges CIOs and IT executives face when creating and managing an enterprise mobility strategy.
.tmb-rc-160x215.png?Culture=en&sfvrsn=6ff9b3f1_2)
The Enterprise Mobility Landscape in Numbers
We live in a world dominated by mobile devices that are shaping the way people interact with the world around them. Here is an infographic that gives us a glimpse into the key trends shaping the way we work and live in the age of mobility. While these trends are creating new challenges for enterprises, they are also opening new doors of opportunities to engage with employees and customers. How can enterprises find solutions to help them overcome these challenges and lead the market with mobile innovation? Here are a few ideas.
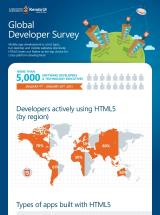
Global Developer Survey
This infographic is a visual representation of the results from the HTML5 survey conducted by Kendo UI among more than 5,000 developers. The survey’s main objective was to determine usage patterns of HTML5—actual adoption versus hype—and platform usage preferences. Respondents were a mix of developers (72%), CIOs/Technology Executives (20%), and others. They work for organizations ranging from start-ups (29%) to enterprises (20%), with a majority of respondents coming from small and medium-sized businesses (51%). Much of the world was also represented in the survey, with 31% from North America, 35% from Europe, and 23% from Asia Pacific.
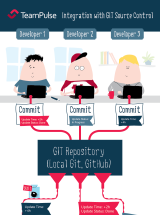
Why You Should Manage Your Git or GitHub Projects with TeamPulse?
Do you find it hard to track how development work in your Git or GitHub project is progressing? Is the development team tired of having to leave their IDEs to update their status of work?
Planning and tracking your Git projects should be simpler than that. That is why we introduced TeamPulse integration with Git and GitHub repositories.
Leveraging the integration with TeamPulse, you are now able to:
- Track code changes associated with TeamPulse work items
- Update TeamPulse work item status and log time through the Git commit comments
Check out this infographic to see the process at a glance.
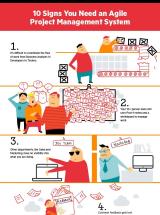
10 Signs You Need an Agile Project Management System
Statistics show that many organizations start their Agile adoption efforts with team rooms, whiteboards and sticky notes. However, as they start to improve and scale their Agile practices the challenges related to coordinating different groups, locations and projects begin to grow exponentially.
Have a look at this infographic, "10 Signs You Need an Agile Project Management System", in which we explore the top 10 challenges related to managing work and teams in growing organizations.