Infographics

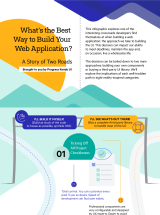
What’s the Best Way to Build Your Web Application?
This decision can be boiled down to two main approaches: building your own components or buying a third-party UI library. We’ll explore the implications of each well-trodden path in eight reality-inspired categories: Ticking off all project checkboxes; UI library documentation; Technical support; External dependencies; Software updates; Component reusability; Money and return on investment; The pleasure factor.
For an in-depth discussion on deciding whether to build your UI in-house or implement an external solution, check out the article linked here.

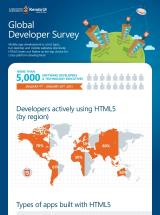
Global Developer Survey
This infographic is a visual representation of the results from the HTML5 survey conducted by Kendo UI among more than 5,000 developers. The survey’s main objective was to determine usage patterns of HTML5—actual adoption versus hype—and platform usage preferences. Respondents were a mix of developers (72%), CIOs/Technology Executives (20%), and others. They work for organizations ranging from start-ups (29%) to enterprises (20%), with a majority of respondents coming from small and medium-sized businesses (51%). Much of the world was also represented in the survey, with 31% from North America, 35% from Europe, and 23% from Asia Pacific.

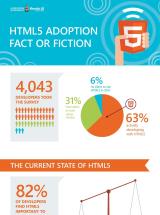
HTML5 Adoption: Fact or Fiction
Kendo UI surveyed over 4,000 software developers all over the world in order to gain insights about the usage of HTML5 and the expectations of developers who have embraced cross-platform development for their future projects.

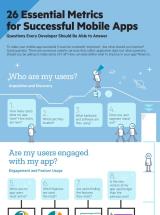
26 Essential Metrics for Successful Mobile Apps
You have a great app idea and have created a mobile app to share your amazing idea with the world. The app made a great impact initially and marketing activities seem to be attracting downloads. But revenue is declining. What's wrong?
The answer is simple: to make your mobile app a success, you need to constantly improve it. In fact, Gartner suggests a release cycle of 1.5 - 2 months for mobile apps. So how should you identify which parts of your app to improve? For this, application analytics are a must.