or
0 answers
122 views
  <Style x:Key="CrashPager"
         TargetType="telerik:RadDataPager"
         BasedOn="{StaticResource {x:Type telerik:RadDataPager}}">
      <Setter Property="Margin"
              Value="0,0,0,0" />
      <Setter Property="Padding"
              Value="0,0,0,0" />
      <Setter Property="Height"
              Value="Auto" />
      <Setter Property="VerticalAlignment"
              Value="Top" />
      <Setter Property="VerticalContentAlignment"
              Value="Top" />
  </Style>
The code above has no margin and no padding.
Something is chopping the bottom from the RadDataPager control.
My guess is that this is being caused by the theme.
How can I get to show the control correctly?


1 answer
143 views
Hi Team,
I'm trying to add a RadNotifyIcon into my telerik wpf project, but it keeps throwing the error below in xaml file
"the name RadNotifyIcon does not exist in the current namespace".
    <telerik:RadNotifyIcon x:Name="NotifyIcon"
                                       ShowTrayIcon="False"
                                       TrayIconSource="/NotifyIcon;component/Icons/TelerikWPFNotifyIcon.ico"
                                       PopupContentTemplate="{StaticResource NotifyIconPopupContentTemplate}" />
I did follow the below options , but still not working.
- clean and rebuild project
- adding reference to the telerik.windows.controls and telerik.windows.controls.navigation
- deleting obj and bin folder and rebuild project
- close and open visual studio
- restart my windows
- change build platform to x86 from anycpu and vice versa.
the visual studio version I'm using is Microsoft Visual Studio Community 2022 (64-bit) - Current, Version 17.4.3
Any suggestion will be helpful.
Thanks,
Lenin.

Dimitar
Telerik team

answered
on
03 Apr 2024
1 answer
115 views
Hello Telerik Team,
We are using Telerik 2023.2.718.45.
If I use PivotFieldList, it is not showing up in the UI for the above version.
But if I try the older version 2020.3.915.45, it is working good.
I don't know what is wrong in the new one.
I have attached the sample project which uses the latest version.
Please refer it and let us know the solution for the same.
I have also attached the screenshot of the UI of both versions.
Thanks,
Muhammad Azhar Shah

Stenly
Telerik team
answered
on
02 Apr 2024
0 answers
308 views
Hi
I have the following datatemplate:
		<DataTemplate
			x:Key="ReportComponentTemplate">
			<Grid>
				<Grid.RowDefinitions>
					<RowDefinition Height="*"/>
					<RowDefinition Height="30"/>
				</Grid.RowDefinitions>
				<Grid.ColumnDefinitions>
					<ColumnDefinition Width="30"/>
					<ColumnDefinition Width="*"/>
				</Grid.ColumnDefinitions>
				<CheckBox IsChecked="{Binding Included}" Margin="5,0"/>
				<TextBlock
					Grid.Column="1" Text="{Binding Didascalia}" HorizontalAlignment="Stretch"
					TextWrapping="Wrap"/>
				<t:RadComboBox Grid.Row="1" Grid.ColumnSpan="2"
					Width="150"
					Visibility="{Binding DataContext.TemplatePath,
						RelativeSource={RelativeSource AncestorType=local:TreeViewReportControl},
						Converter={StaticResource StringEmptyToHide}}"
					VerticalAlignment="Top" Margin="5,0"
					HorizontalAlignment="Left"
					ItemsSource="{Binding TagsDisponibili}"
					SelectedItem="{Binding TagSelezionato, NotifyOnTargetUpdated=True, Mode=TwoWay}">
					<i:Interaction.Triggers>
						<i:EventTrigger EventName="SelectionChanged">
							<i:InvokeCommandAction Command="{Binding DataContext.TagSelezionatoUpdatedCommand
								, RelativeSource={RelativeSource AncestorType=local:TreeViewReportControl}}"/>
						</i:EventTrigger>
					</i:Interaction.Triggers>
				</t:RadComboBox>
			</Grid>
</DataTemplate>The Vsual tree is the following:
<t:RadDocking>
	<t:RadSplitContainer MaxWidth="600" t:DockingPanel.InitialSize="400,150" Name="LeftContainer" InitialPosition="DockedLeft">
		<t:RadPaneGroup>
			<t:RadPane>
				<Grid>
					<t:RadBusyIndicator>
						<t:RadTreeView>
						</t:RadTreeView>
					</t:RadBusyIndicator>
				</Grid>
			</t:RadPane>
		</t:RadPaneGroup>
	</t:RadSplitContainer>
</t:RadDocking>
Of course there are many other controls.
The strange here it is that textblock inside the row 1 of ReportComponentTemplate systematically overflow the width of its parents.
I can set a fixed width or a maxwidth, but I want that it occupy the full available area (but not over).
Thank you
Luigi

1 answer
177 views
Hello,
I wanted layout as per images shared with the questions/forums. You also provided with me solutions but I am not able to draw the layout as per wish.
[ I am sharing here another picture of layout if possible can you please show me a workaround.
I am also attaching the sample project so if i am doing anything wrong can you please check?
Stenly
Telerik team
answered
on
01 Apr 2024
0 answers
144 views
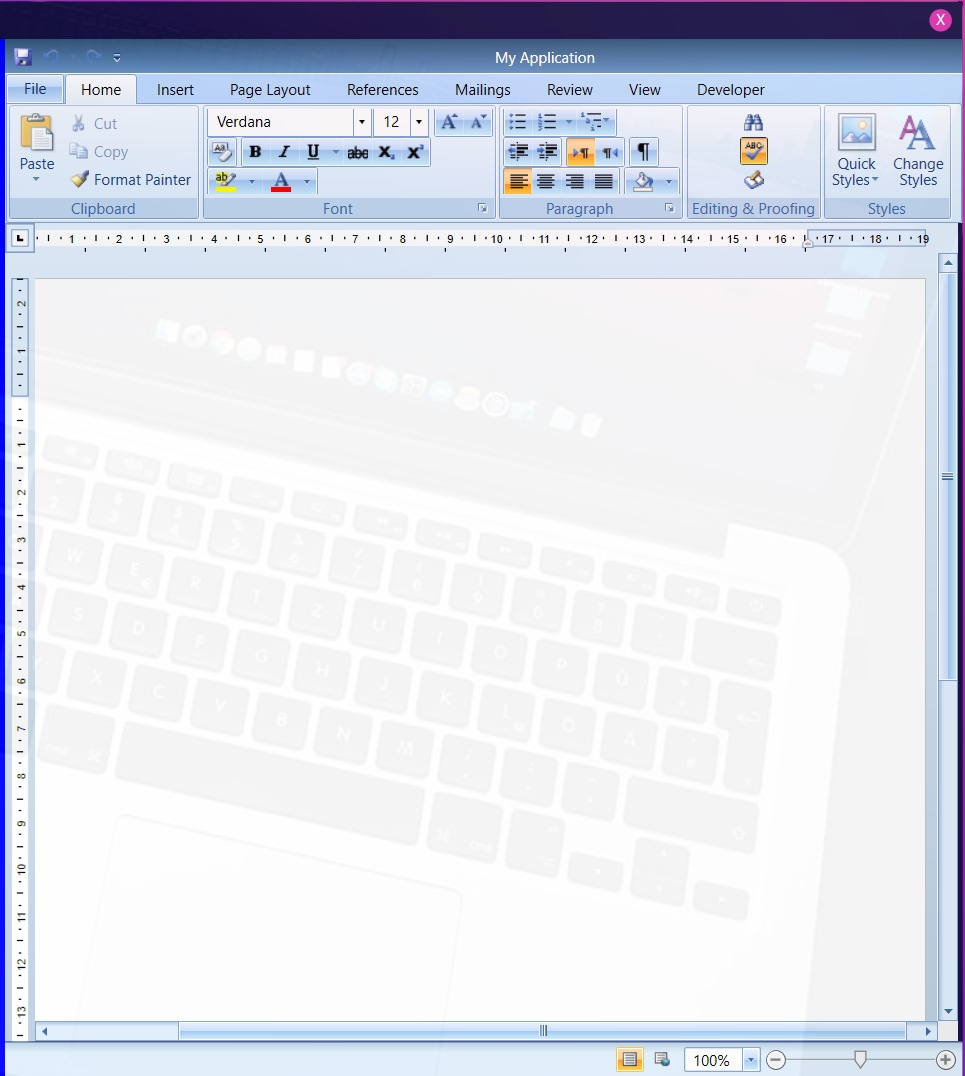
I'am using Telerik RichTextBox (trial) control in my WPF desktop application. When running the app, the control(WordControl) showing as transparent. Suppose the background image (laptop) should not be seen.
**WordControl.xaml**
```
<UserControl x:Class="MyApp.WordControl"
xmlns="http://schemas.microsoft.com/winfx/2006/xaml/presentation"
xmlns:x="http://schemas.microsoft.com/winfx/2006/xaml"
xmlns:mc="http://schemas.openxmlformats.org/markup-compatibility/2006"
xmlns:d="http://schemas.microsoft.com/expression/blend/2008"
xmlns:telerik="http://schemas.telerik.com/2008/xaml/presentation"
mc:Ignorable="d"
d:DesignHeight="450" d:DesignWidth="800">
<Grid x:Name="radRichTextBoxParent">
<Grid.Resources>
<Grid.RowDefinitions>
<RowDefinition Height="Auto"/>
<RowDefinition Height="*"/>
<RowDefinition Height="Auto"/>
</Grid.RowDefinitions>
<Grid Grid.Row="1">
<Grid.ColumnDefinitions>
<ColumnDefinition Width="*"/>
<ColumnDefinition Width="4"/>
<ColumnDefinition MaxWidth="780" Width="Auto"/>
</Grid.ColumnDefinitions>
<telerik:DocumentRuler>
<telerik:RadRichTextBox x:Name="radRichTextBox" IsSelectionMiniToolBarEnabled="True" IsSpellCheckingEnabled="True" IsContextMenuEnabled="True" LayoutMode="Paged"/>
</telerik:DocumentRuler>
<GridSplitter Background="{Binding Background, ElementName=TaskPane}" BorderThickness="1 0" Grid.Column="1" HorizontalAlignment="Stretch" Visibility="{Binding Visibility, ElementName=TaskPane}"/>
<telerik:TaskPane x:Name="TaskPane" AssociatedRichTextBox="{Binding ElementName=radRichTextBox}" Grid.Column="2" HorizontalAlignment="Stretch" MinWidth="265" VerticalAlignment="Stretch"/>
</Grid>
<telerik:RadRichTextBoxRibbonUI x:Name="ribbon"> ...</telerik:RadRichTextBoxRibbonUI>
<telerik:RadRichTextBoxStatusBar />
</Grid>
</UserControl>
```
**BrowserControl.xaml**
```
<UserControl x:Class="MyApp.BrowserControl"
xmlns="http://schemas.microsoft.com/winfx/2006/xaml/presentation"
xmlns:x="http://schemas.microsoft.com/winfx/2006/xaml"
xmlns:mc="http://schemas.openxmlformats.org/markup-compatibility/2006"
xmlns:d="http://schemas.microsoft.com/expression/blend/2008"
xmlns:local="clr-namespace:MyApp"
xmlns:wv2="clr-namespace:Microsoft.Web.WebView2.Wpf;assembly=Microsoft.Web.WebView2.Wpf"
mc:Ignorable="d"
d:DesignHeight="450" d:DesignWidth="800">
<Grid x:Name="MainGrid">
<Grid.ColumnDefinitions>
<ColumnDefinition Width="4*"/>
<ColumnDefinition Width="0*"/>
</Grid.ColumnDefinitions>
<wv2:WebView2 Name="webView" Grid.Column="0" Grid.Row="0" Margin="0,0,6,0" />
<GridSplitter x:Name="MainGridSplit" Visibility="Hidden" HorizontalAlignment="Right" Grid.RowSpan="3" MinWidth="5" MinHeight="5" Background="Blue"/>
**<local:WordControl x:Name="wordEditor" Grid.Column="1" Grid.Row="0" Margin="0,0,0,0" />**
</Grid>
</UserControl>
```
**MainWindow.xaml**
```
<Window x:Class="MyApp.MyWindow"
xmlns="http://schemas.microsoft.com/winfx/2006/xaml/presentation"
xmlns:x="http://schemas.microsoft.com/winfx/2006/xaml"
xmlns:d="http://schemas.microsoft.com/expression/blend/2008"
xmlns:mc="http://schemas.openxmlformats.org/markup-compatibility/2006"
xmlns:local="clr-namespace:MyApp"
xmlns:controls="clr-namespace:MyApp.Controls"
mc:Ignorable="d"
ResizeMode="NoResize" WindowStartupLocation="CenterScreen" Loaded="Window_Loaded"
WindowState="Maximized" WindowStyle="None" Background="#060531"
AllowsTransparency="False" Title="MyWindow" Height="450" Width="800">
<Border CornerRadius="12">
<Border.Background>
<ImageBrush ImageSource="Images/back-image.jpg"
Stretch="UniformToFill"/>
</Border.Background>
<Border CornerRadius="0" BorderThickness="2" Opacity="0.95">
<Border.BorderBrush>
<LinearGradientBrush StartPoint="0,0" EndPoint="1,1">
<GradientStop Color="#462AD8" Offset="0"/>
<GradientStop Color="#DA34AE" Offset="0.75"/>
<GradientStop Color="#8A16C1" Offset="1"/>
</LinearGradientBrush>
</Border.BorderBrush>
<Border.Background>
<LinearGradientBrush StartPoint="0,1" EndPoint="1,0">
<GradientStop Color="#060531" Offset="0"/>
<GradientStop Color="#1B1448" Offset="1"/>
</LinearGradientBrush>
</Border.Background>
<Grid>
<Grid.RowDefinitions>
<RowDefinition Height="30"/>
<RowDefinition/>
</Grid.RowDefinitions>
**<local:BrowserControl x:Name="browserControl" Grid.Row="1" ></local:BrowserControl>**
</Grid>
</Border>
</Border>
</Window>
```
I am expecting the WordControl should not be transparent.
Murad
Top achievements
 Rank 1
updated question
on
01 Apr 2024
0 answers
128 views
Hello!
I'm using a `<RadCartesianChart>` with `<ScatterAreaSeries> to visualize some data as a histogram.
I'd like the user to be able to select a data point in that chart.
I've been using this guide: https://docs.telerik.com/devtools/wpf/controls/radchartview/features/behaviors/selection
but nothing seems to work.
If I add
<telerik:RadCartesianChart.Behaviors>
    <telerik:ChartSelectionBehavior />
</telerik:RadCartesianChart.Behaviors>
I still can't seem to select anything. The `SelectionChanged` event also never arrives when I click on the chart.
When I set a random point as selected programmatically via:
RadCartesianChart chart = this.GetTemplateChild("Histogram_Chart") as RadCartesianChart;
var chartSeries = (ScatterAreaSeries)chart.Series[0];
ScatterDataPoint dataPoint = chartSeries.DataPoints[10];
dataPoint.IsSelected = true;
it still doesn't change how the chart looks.
Am I missing something or is selection just not possible for ScatterAreaSeries?
Thanks in advance!
0 answers
127 views
how to set AvoidConnectionOverlap Property in diagram with example?
0 answers
201 views
Hello. Please give an idea to start with ...
I have RadWatermarkTextBox. And I've added INotifyDataErrorInfo to my VM implementation.
When DisplayMode is Static - I can see validation errors. But When it's Tooltip telerik:ValidationErrorTemplateHelper.DisplayMode="ToolTip"
I can't see.
By the way. if I use static mode I also don't see red bottom border line. And red arrow at top right corner, my error text is just a black font without read rectangle around and etc.
Looks like missing styles. But I can't understand which one. I imported xaml files for Win11 style. I see that there is a definition for RadWatermarkTextBox Validation Styles.
0 answers
130 views
Hello,
im trying to set the focus on a ListBoxItem so the User can navigate to the next Index by pressing the down button.
Our current implementation is that the focus is set on the RadListBox itself and not on the item but you need to double press down to get the second item.
Is there some way to set the focus on the items itself rather than the ListBox?
I already tried something like this but this is not working. if (ListBox.SelectedItem != null)
{
var item = ListBox.ItemContainerGenerator.ContainerFromIndex(ListBox.SelectedIndex);
if(item != null)
{
((RadListBoxItem)item).Focus();
}
else
{
ListBox.Focus();
}
}


