or
3 answers
171 views
Hello
i can't resolve This error . registerTime Property Is String
i can't resolve This error . registerTime Property Is String

Rossen Hristov
Telerik team

answered
on
09 Dec 2010
2 answers
103 views
Hi telerik,
I've created two custom filters for my RadGridView and everything works fine.
When I'm going to filter data with filter "A" and + filter "B". Only one filter is going to filter data.
I want to filter data by using two of them (filter A + filter B).
What should I do for that ?
thank you,
Julian
I've created two custom filters for my RadGridView and everything works fine.
When I'm going to filter data with filter "A" and + filter "B". Only one filter is going to filter data.
I want to filter data by using two of them (filter A + filter B).
What should I do for that ?
thank you,
Julian

Julian
Top achievements
 Rank 1
answered
on
09 Dec 2010
1 answer
241 views
Dear Telerik,
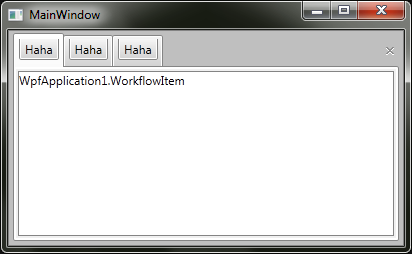
RadPaneGroup inherited from ItemsControl and can contain a list of RadDocumentPane. I want to use RadDocumentPane as ItemTemplate of RadPaneGroup. The code is:
There is no error when building and running. But the UI has problem. (See attached file)
http://www.telerik.com/ClientsFiles/235713_ui-problem.png
BTW: I just tried, use RadPane as ItemTemplate will cause the same problem.
RadPaneGroup inherited from ItemsControl and can contain a list of RadDocumentPane. I want to use RadDocumentPane as ItemTemplate of RadPaneGroup. The code is:
<t:RadSplitContainer> <t:RadPaneGroup ItemsSource="{Binding WorkflowItems}"> <t:RadPaneGroup.ItemTemplate> <DataTemplate> <t:RadDocumentPane Header="{Binding Name}" Content="{Binding Workflow}"> <t:RadDocumentPane.ContentTemplate> <DataTemplate> <TextBlock Text="{Binding}" /> </DataTemplate> </t:RadDocumentPane.ContentTemplate> </t:RadDocumentPane> </DataTemplate> </t:RadPaneGroup.ItemTemplate> </t:RadPaneGroup> </t:RadSplitContainer>There is no error when building and running. But the UI has problem. (See attached file)
http://www.telerik.com/ClientsFiles/235713_ui-problem.png
BTW: I just tried, use RadPane as ItemTemplate will cause the same problem.
Miroslav Nedyalkov
Telerik team
answered
on
09 Dec 2010
5 answers
337 views
I've got a recent problem:
My grid looks like this:
Grid shows objects with filled values (in this case object's property is ExpositionType). Everythig looks fine until grid is scrolled via vertical scrollbar. When row goes out of the visibility range null value is inserted into the object's ExpositionType property.
I dont use GridViewComboBoxColumn because I want to edit values without switching grid into edit mode (it requires more clicks).
My question is: how to prevent grid from deleting my data when scrolled?
My grid looks like this:
<telerikG:RadGridView x:Name="ExpositionFilterRules" AutoGenerateColumns="False" SelectionMode="Single" FontSize="14" AllowDrop="False" CanUserDeleteRows="False" CanUserFreezeColumns="False" CanUserInsertRows="False" CanUserReorderColumns="False" ShowGroupPanel="False" RowIndicatorVisibility="Collapsed" ScrollMode="Deferred" IsEnabled="True" IsReadOnly="False"> <telerikG:RadGridView.Columns> <telerikG:GridViewDataColumn Header="{StaticResource Promotions_ExpositionRule_ExpositionType}" MinWidth="200"> <telerikG:GridViewDataColumn.CellTemplate> <DataTemplate> <ComboBox ItemsSource="{DynamicResource ExpositionTypes}" SelectedItem="{Binding ExpositionType}"></ComboBox> </DataTemplate> </telerikG:GridViewDataColumn.CellTemplate> </telerikG:GridViewDataColumn> </telerikG:RadGridView.Columns> </telerikG:RadGridView>Grid shows objects with filled values (in this case object's property is ExpositionType). Everythig looks fine until grid is scrolled via vertical scrollbar. When row goes out of the visibility range null value is inserted into the object's ExpositionType property.
I dont use GridViewComboBoxColumn because I want to edit values without switching grid into edit mode (it requires more clicks).
My question is: how to prevent grid from deleting my data when scrolled?
Maya
Telerik team
answered
on
09 Dec 2010
2 answers
54 views
Please help me in navigating to a link if hyperlink is specified in grid view column cells
Urgent
Urgent
2 answers
80 views
Hi,
Yesterday, I've faced with the situation that I can't set the value of the check box to my custom filter.
Well, take a look on that:
<CheckBox x:Name="myCheckBox"/>
<telerik:RadGridView.Columns>
<telerik:GridViewDataColumn>
<CustomFilter:MyCustomFilter GetTheValueOfCheckBox={Binding ElementName=myCheckBox, Path=IsChecked}
</telerik:GridViewDataColumn>
</telerik:RadGridView.Columns>
<telerik:RadGridView x:Name="myGrid">
</telerik:RadGridView/>
In code behind of the MyCustomFilter I registered my DependencyProperty.
I have to addmit, that we use MVVM and the grid is a view part only without codebehind.
How can I handle this issue ?
Thank you in advance,
Julian
Julian
Top achievements
Rank 1
answered
on
09 Dec 2010
1 answer
445 views
Hello,
Setting the content of a label to A_B_C_D for instance renders the text as AB(underlined)_C_D (please see the attached screenshot).
The TreeListView control behaves exactly the same, so I can only assume this applies to all the controls.
How do I make sure my text gets displayed correctly?
Thanks,
Setting the content of a label to A_B_C_D for instance renders the text as AB(underlined)_C_D (please see the attached screenshot).
The TreeListView control behaves exactly the same, so I can only assume this applies to all the controls.
How do I make sure my text gets displayed correctly?
Thanks,
Vanya Pavlova
Telerik team
answered
on
09 Dec 2010
1 answer
176 views
Hi,
Is there an easy way (without making a full template) to customise the insert row ?
I've set CanInsertRows and ShowInsertRow to true and ive got a row with the text "Click here to add a new item" as the first row. I would prefer toe have an empty row at the end representing the new row...
Is there an easy way (without making a full template) to customise the insert row ?
I've set CanInsertRows and ShowInsertRow to true and ive got a row with the text "Click here to add a new item" as the first row. I would prefer toe have an empty row at the end representing the new row...
<trk:RadGridView x:Name="tblSanctDecisMed" Height="130" trkT:StyleManager.Theme="Windows7" AutoGenerateColumns="False" RowIndicatorVisibility="Visible" Width="682" Margin="10" HorizontalAlignment="Left" ScrollViewer.VerticalScrollBarVisibility="Visible" ReorderColumnsMode="None" ShowGroupPanel="false" ItemsSource ="{Binding Path=MembresEquipe}" CanUserDeleteRows="False" CanUserFreezeColumns="False" CanUserInsertRows="True" CanUserReorderColumns="False" CanUserSortColumns="True" ShowInsertRow="True" IsBusy="False" IsScrolling="False" > <trk:RadGridView.Columns> <trk:GridViewDataColumn Header="Matricule" Width="125" DataMemberBinding="{Binding Path=NoMatricule}" IsFilterable="False" IsGroupable="False" /> <trk:GridViewDataColumn Header="Nom/Prénom" Width="*" DataMemberBinding="{Binding Path=NomEmploye}" IsFilterable="False" IsGroupable="False" IsReadOnly="True" /> </trk:RadGridView.Columns> </trk:RadGridView>
Vanya Pavlova
Telerik team
answered
on
09 Dec 2010
1 answer
260 views
Is this possible to put <telerik:RadContextMenu.ContextMenu> in <ControlTemplate.Resources> and trigger Opened event of the context menu, if yes then please send the code.
Thanks
Amar
Thanks
Amar
Hristo
Telerik team
answered
on
09 Dec 2010
1 answer
239 views
I am dynamically adding GridViewColumns in code and use a CellTemplateSelector to format the cells. That works. However, I would really like to just use AutoGeneratingColumns=True and still use the CellTemplateSelector mechanism. Is that possible? My attempts seem to indicate it is not. Thanks for any assistance on this.
Vanya Pavlova
Telerik team
answered
on
09 Dec 2010


