This is a migrated thread and some comments may be shown as answers.

Timediagram

2 Answers 49 Views
Chart (obsolete as of Q1 2013)
This is a migrated thread and some comments may be shown as answers.
This question is locked. New answers and comments are not allowed.
Marc Schrader
Top achievements
Rank 1
Marc Schrader asked on 15 Sep 2011, 09:43 AM
Dear Telerik Team,
I got gold historical data like this:

"2011-07-07 15:08:39" - "Valid"
"2011-07-07 15:09:20" - "Valid"
"2011-07-07 15:10:39" - "Invalid"
"2011-07-07 15:11:26" - "Valid"

and so on.
How can i build like a graph like
http://h4.abload.de/img/unbenanntcpzc.png


I also got this data only in memory as an List<object>.

Many thanks

2 Answers, 1 is accepted

Sort by
0
Marc Schrader
Top achievements
Rank 1
answered on 19 Sep 2011, 03:09 PM
Dear Telerik Team,
I am still working on this issue. I found the NumericalAxis Demo Project very interesting for this one. So I implemented this in my project. Everything was working well, like in the demo. Now I try to add my specific data to it.

My Method look like this :

List<DateTime> data = _scriptLogParser.GetLogEntrys();
 
const double hourStep = 1 / 24.0;
const double minuteStep = hourStep / 60;
 
double startTime = data.First().ToOADate();
double endTime = data.Last().ToOADate();
 
string start = data.First().ToString();
string end = data.Last().ToString();
 
radChart1.PlotArea.XAxis.AddRange(startTime, endTime, hourStep);
 
ChartSeries series = radChart1.Series[0];
series.Items.Clear();
 
 
for (double currentTime = startTime; currentTime < endTime; currentTime += minuteStep)
{
    ChartSeriesItem item = new ChartSeriesItem();
    item.XValue = currentTime * minuteStep;
 
    DateTime test = DateTime.FromOADate(currentTime);
 
    int index = data.FindIndex(p => p == DateTime.FromOADate(currentTime));
    item = new ChartSeriesItem();
 
    if (index >= 0)
    {
        item.YValue = 1;
    }
    else
    {
        item.YValue = 0;
    }
 
    series.Items.Add(item);
}
 
radChart1.Series.Add(series);
radChart1.DataBind();


First I get my data from "_scriptLogParser.GetLogEntrys();".

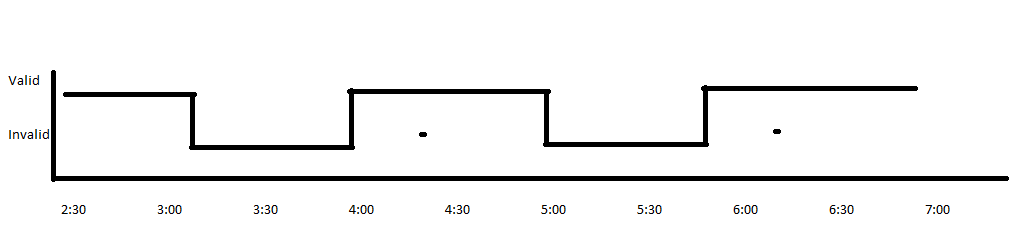
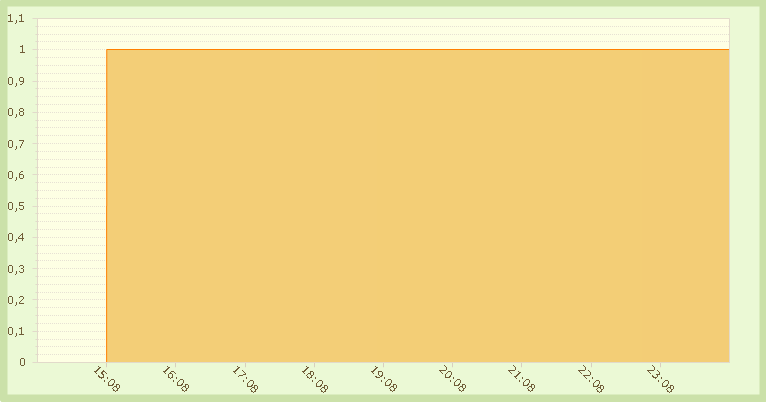
After that I set the start date and end date and interate through this in minute steps. I debug this part and it worked pretty well. But my Output is false. It looks like this :

http://h7.abload.de/img/falseiu67.png

This is not correct. I manipulate the data. So I got data from 15 till 18 o´clock. Than nothing and then the data come up at 23 o´clock. But it seems that the chart is displaying there was always data. 

Where is my wrong line ?

Thanks again.
0
Yavor
Telerik team
answered on 20 Sep 2011, 09:55 AM
Hi Marc,

Based on the supplied information, it is hard to determine what is causing this unwanted output. If this issue persists, you can open a formal support ticket, and send us a small project, demonstrating your setup, and showing the issue. We will debug it locally, and advise you further.

Kind regards,
Yavor
the Telerik team

Explore the entire Telerik portfolio by downloading the Ultimate Collection trial package. Get it now >>

Tags
Chart (obsolete as of Q1 2013)
Asked by
Marc Schrader
Top achievements
Rank 1
Answers by
Marc Schrader
Top achievements
Rank 1
Yavor
Telerik team
Share this question
or