I'd like to have a multiple vertical column part of my report, that simulates a datagrid - column header, row that are generated from the fields that I place in each column... . Is this possible? What would be the best approach?
Kind regards
3 Answers, 1 is accepted
0
Steve
Telerik team
answered on 03 Jul 2008, 01:45 PM
Hello John,
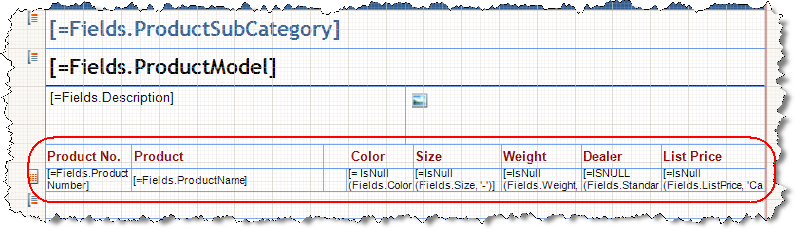
Since you need to
output some kind of table I would suggest to you to arrange the TextBox items
exactly in a table manner. Arrange all items in columns with exactly the same
width and use the Style.TextAlign and Style.VerticalAlign to adjust the text position inside the
TextBox item. For example please see the ProductCatalog sample report and note how it looks like in
the designer:
We are currently working on an item that enables table layout and we should have it till the end of the year (or beginning of next one).
In the sample you posted, the lines or boxes that look like tables around the data text boxes, is that done on each individual text box by setting its border style(s), or is there a table that I can drop on a report and place a data text box inside each cell?
Thx for your help.
J
0
Steve
Telerik team
answered on 03 Jul 2008, 03:55 PM
Hello John,
We currently do not have a table item, but it is in our TODO list for a subsequent version of the Report tool. The screenshot from the example I've posted is done using only the beforementioned technique - arrange all items in columns with exactly the same
width and use the Style.TextAlign and Style.VerticalAlign to adjust the text position inside the
TextBox item.
You can also read more about dynamic layout in this help article.