5 Answers, 1 is accepted
0


Hello,
In order to change the shape for the points in the ScatterSeries, you can set the ScatterSeries.Shape property as it is demonstrated below:
I hope this information helps.
Note that most of the forum threads are reviewed by Telerik representatives and sometimes we address the questions asked by our customers in the forums as well. However, a post in the forum doesn't guarantee you a response from the Telerik support team. Moreover, threads are handled according to license and time of posting, so if it is an urgent problem, we suggest you use a support ticket, which would be handled before a forum thread
Regards,
Dess | Tech Support Engineer, Sr.
Progress Telerik
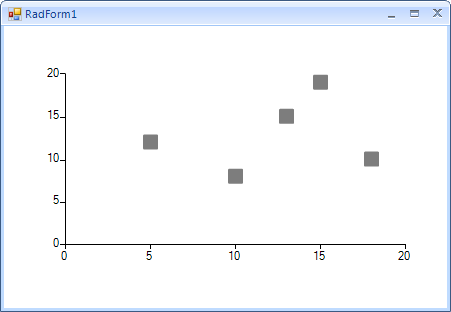
In order to change the shape for the points in the ScatterSeries, you can set the ScatterSeries.Shape property as it is demonstrated below:
ScatterSeries scatterSeries = new ScatterSeries();scatterSeries.Shape = new RoundRectShape(1);scatterSeries.PointSize = new SizeF(15, 15);scatterSeries.DataPoints.Add(new ScatterDataPoint(15, 19));scatterSeries.DataPoints.Add(new ScatterDataPoint(18, 10));scatterSeries.DataPoints.Add(new ScatterDataPoint(13, 15));scatterSeries.DataPoints.Add(new ScatterDataPoint(10, 8));scatterSeries.DataPoints.Add(new ScatterDataPoint(5, 12));this.radChartView1.Series.Add(scatterSeries);I hope this information helps.
Note that most of the forum threads are reviewed by Telerik representatives and sometimes we address the questions asked by our customers in the forums as well. However, a post in the forum doesn't guarantee you a response from the Telerik support team. Moreover, threads are handled according to license and time of posting, so if it is an urgent problem, we suggest you use a support ticket, which would be handled before a forum thread
Regards,
Dess | Tech Support Engineer, Sr.
Progress Telerik
Get quickly onboarded and successful with your Telerik and/or Kendo UI products with the Virtual Classroom free technical training, available to all active customers. Learn More.
0

asghar
Top achievements
 Rank 1
answered on 02 Jan 2019, 02:04 PM
tnx
i find this code for (+)
public class CrossShape : ElementShape
{
public CrossShape()
{
this.Width = 20;
}
public override GraphicsPath CreatePath(Rectangle bounds)
{
GraphicsPath path = new GraphicsPath();
path.AddRectangle(new RectangleF(bounds.X, (bounds.Y + bounds.Height / 2) - Width / 2, bounds.Width, Width));
path.AddRectangle(new RectangleF((bounds.X + bounds.Width / 2) - Width / 2, bounds.Y, Width, bounds.Height));
path.CloseFigure();
return path;
}
public int Width { get; set; }
}
now i want (×)
0
Hello,
Creating a derivative of ElementShape gives you the opportunity to create your own custom shapes by defining a GraphicsPath. However, the exact custom implementation is not directly connected to RadChartView. I believe that this task has been discussed in online forums and there should be useful tips on how to approach it on MSDN or StackOverflow.
I hope this information helps.
Regards,
Dess | Tech Support Engineer, Sr.
Progress Telerik
Get quickly onboarded and successful with your Telerik and/or Kendo UI products with the Virtual Classroom free technical training, available to all active customers. Learn More.
0
asghar
Top achievements
Rank 1
answered on 05 Jan 2019, 12:07 PM
i can not find.
i just want show(×) Instead of default shape on point.
0
Hello,
I would like to note this is a custom requirement and it is out of the scope of the support service. However, as a gesture of good will, we will address this last thread for you and suggest a sample solution:
I hope this information helps.
Regards,
Dess | Tech Support Engineer, Sr.
Progress Telerik
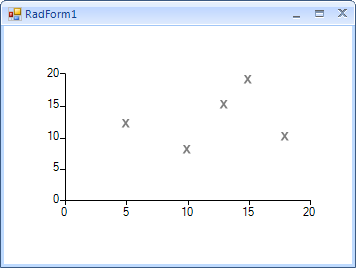
I would like to note this is a custom requirement and it is out of the scope of the support service. However, as a gesture of good will, we will address this last thread for you and suggest a sample solution:
public RadForm1(){ InitializeComponent(); ScatterSeries scatterSeries = new ScatterSeries(); scatterSeries.Shape = new CrossShape(); scatterSeries.PointSize = new SizeF(15, 15); scatterSeries.DataPoints.Add(new ScatterDataPoint(15, 19)); scatterSeries.DataPoints.Add(new ScatterDataPoint(18, 10)); scatterSeries.DataPoints.Add(new ScatterDataPoint(13, 15)); scatterSeries.DataPoints.Add(new ScatterDataPoint(10, 8)); scatterSeries.DataPoints.Add(new ScatterDataPoint(5, 12)); this.radChartView1.Series.Add(scatterSeries);}public class CrossShape : ElementShape{ public CrossShape() { this.Width = 1; } public override GraphicsPath CreatePath(Rectangle bounds) { GraphicsPath path = new GraphicsPath(); path.AddString("X", new FontFamily("Arial"), 1, 12f, new Point(bounds.X, bounds.Y), StringFormat.GenericDefault); return path; } public int Width { get; set; }}I hope this information helps.
Regards,
Dess | Tech Support Engineer, Sr.
Progress Telerik
Get quickly onboarded and successful with your Telerik and/or Kendo UI products with the Virtual Classroom free technical training, available to all active customers. Learn More.