I need to have multiple series in the same charts of different x axis types. I looked through the forum and so far the examples show multiple axis but they are always the same type like a linear series with categorical data points and a datetime continuous x axis. What I need is for one series to be a linear series with a datetime axis and another series to be a scatter line series with it's own x axis that takes proper doubles.
4 Answers, 1 is accepted
0


Hello, Jimmy,
You can add a ScatterLineSeries and a LineSeries to the same RadChartView control. You can also specify the desired axis before adding the series to the RadChartView.Series collection. Please refer to the following help articles demonstrating how to add multiple axes:
https://docs.telerik.com/devtools/winforms/controls/chartview/axes/datetime
https://docs.telerik.com/devtools/winforms/controls/chartview/axes/multiple-axes
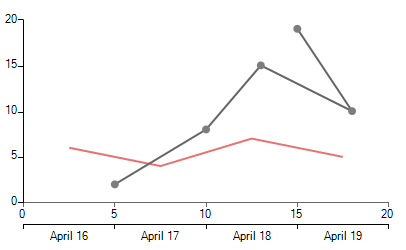
The code snippet below shows how to achieve the result illustrated
in the screenshot:
I hope this information helps. If you need any further assistance please don't hesitate to contact me.
Regards,
Dess | Tech Support Engineer, Sr.
Progress Telerik
You can add a ScatterLineSeries and a LineSeries to the same RadChartView control. You can also specify the desired axis before adding the series to the RadChartView.Series collection. Please refer to the following help articles demonstrating how to add multiple axes:
https://docs.telerik.com/devtools/winforms/controls/chartview/axes/datetime
https://docs.telerik.com/devtools/winforms/controls/chartview/axes/multiple-axes
The code snippet below shows how to achieve the result illustrated
in the screenshot:
ScatterLineSeries scatterSeries = new ScatterLineSeries();scatterSeries.DataPoints.Add(new ScatterDataPoint(15, 19));scatterSeries.DataPoints.Add(new ScatterDataPoint(18, 10));scatterSeries.DataPoints.Add(new ScatterDataPoint(13, 15));scatterSeries.DataPoints.Add(new ScatterDataPoint(10, 8));scatterSeries.DataPoints.Add(new ScatterDataPoint(5, 2));scatterSeries.PointSize = new SizeF(8, 8);this.radChartView1.Series.Add(scatterSeries); LineSeries series = new LineSeries();series.DataPoints.Add(new CategoricalDataPoint(6, DateTime.Now));series.DataPoints.Add(new CategoricalDataPoint(4, DateTime.Now.AddDays(1)));series.DataPoints.Add(new CategoricalDataPoint(7, DateTime.Now.AddDays(2)));series.DataPoints.Add(new CategoricalDataPoint(5, DateTime.Now.AddDays(3)));DateTimeCategoricalAxis categoricalAxis = new DateTimeCategoricalAxis();categoricalAxis.DateTimeComponent = DateTimeComponent.Day;categoricalAxis.PlotMode = AxisPlotMode.BetweenTicks;categoricalAxis.LabelFormat = "{0:m}";series.HorizontalAxis = categoricalAxis;radChartView1.Series.Add(series);I hope this information helps. If you need any further assistance please don't hesitate to contact me.
Regards,
Dess | Tech Support Engineer, Sr.
Progress Telerik
Get quickly onboarded and successful with your Telerik and/or Kendo UI products with the Virtual Classroom free technical training, available to all active customers. Learn More.
0

Jimmy
Top achievements
 Rank 1
answered on 16 Apr 2019, 03:15 PM
if I paste in the code above it works fine. However, if you switch the order of the series you get an error (attached). Most of the time the categorical series will be added first. Not last in my situation. The scatter series will be drawn in by mouse. I have it working for situations where the series is all numerical (scatter data point). but I need the solution to work for date time x axis as well. The requirements are that the data points drawn in does NOT have to be linear. In other words, they can draw a circle (if they really wanted) see the screenshot for the magenta series. The code only seems to specify an axis for the LineSeries object. is there one I can use for the scatter line series? I assume it creates a linear axis by default for that type. correct? Anyway thanks for the reply, I look forward to your help on this.
0
Jimmy
Top achievements
Rank 1
answered on 16 Apr 2019, 04:34 PM
just a sec - I think I see what I did wrong.. standby..
0
Hello, Jimmy,
According to your last reply, I suppose that you have found a possible problem on your end. Take as much time as you need to further investigate it. However, I just would like to note that the DateTimeCategoricalAxis is relevant for DateTime values. But the ScatterDataPoint accept two numeric values. Feel free to use a LineSeries instead if you want to have a date axis.
I am looking forward to your reply.
Regards,
Dess | Tech Support Engineer, Sr.
Progress Telerik
Get quickly onboarded and successful with your Telerik and/or Kendo UI products with the Virtual Classroom free technical training, available to all active customers. Learn More.