This question is locked. New answers and comments are not allowed.
Hi everyone, could you give me a example how to use mulitple axes in Xamarin.iOS, it looks like example here http://d585tldpucybw.cloudfront.net/sfimages/default-source/productsimages/ui-for-xamarin/chart/axes_type_support.png?sfvrsn=2 ,
I have download example in apple appStore, but i can't find example like that ,
thanks
2 Answers, 1 is accepted
0
Accepted


Hello Dang,
You can find an example of configuring the Axes like that here in the Axes Overview documentation (see the "Spending on Education" example). In addition to configuring the Axes, take a look at how to create a LineSeries here and a ColumnSeries here.
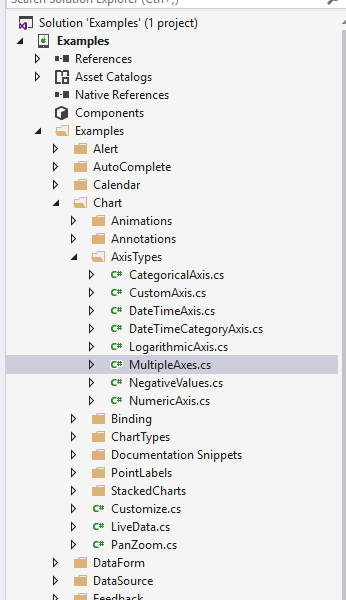
If you'd like to explore the full examples, you can find them on your machine at: C:\Program Files (x86)\Telerik\UI for Xamarin R3 2016\Examples\iOS
After opening the solution, find the Multiple Axes chart demo here (for your convenience, I've pasted in the code at the end of this replyt)
Please let us know if you have any further questions.
License note:
I see that your license has expired, you can get your UI for Xamarin license and submit support tickets directly to the UI for Xamarin support team if you upgrade your DevCraft Complete to a DevCraft Ultimate. Please let us know if we can help assist.
Multiple Axes Example code:
Regards,
Lance | Tech Support Engineer, Sr.
Telerik by Progress
You can find an example of configuring the Axes like that here in the Axes Overview documentation (see the "Spending on Education" example). In addition to configuring the Axes, take a look at how to create a LineSeries here and a ColumnSeries here.
If you'd like to explore the full examples, you can find them on your machine at: C:\Program Files (x86)\Telerik\UI for Xamarin R3 2016\Examples\iOS
After opening the solution, find the Multiple Axes chart demo here (for your convenience, I've pasted in the code at the end of this replyt)
Please let us know if you have any further questions.
License note:
I see that your license has expired, you can get your UI for Xamarin license and submit support tickets directly to the UI for Xamarin support team if you upgrade your DevCraft Complete to a DevCraft Ultimate. Please let us know if we can help assist.
Multiple Axes Example code:
public override void ViewDidLoad () { base.ViewDidLoad (); TKChart chart = new TKChart (this.View.Bounds); chart.AutoresizingMask = UIViewAutoresizing.FlexibleWidth | UIViewAutoresizing.FlexibleHeight; this.View.AddSubview (chart); TKChartNumericAxis gdpInPoundsYAxis = new TKChartNumericAxis (new NSNumber(1050), new NSNumber(1400)); gdpInPoundsYAxis.MajorTickInterval = 50; gdpInPoundsYAxis.Position = TKChartAxisPosition.Left; gdpInPoundsYAxis.Style.LabelStyle.TextAlignment = TKChartAxisLabelAlignment.Left; gdpInPoundsYAxis.Style.MajorTickStyle.TicksHidden = false; gdpInPoundsYAxis.Style.LineHidden = false; chart.AddAxis (gdpInPoundsYAxis); chart.YAxis = gdpInPoundsYAxis; // >> chart-axis-position-cs TKChartDateTimeAxis periodXAxis = new TKChartDateTimeAxis (); periodXAxis.MajorTickIntervalUnit = TKChartDateTimeAxisIntervalUnit.Years; periodXAxis.MinorTickIntervalUnit = TKChartDateTimeAxisIntervalUnit.Years; periodXAxis.MajorTickInterval = 1; periodXAxis.Position = TKChartAxisPosition.Bottom; periodXAxis.PlotMode = TKChartAxisPlotMode.BetweenTicks; chart.AddAxis (periodXAxis); TKChartNumericAxis gdpInvestmentYAxis = new TKChartNumericAxis (new NSNumber(0), new NSNumber(20)); gdpInvestmentYAxis.MajorTickInterval = 5; gdpInvestmentYAxis.Position = TKChartAxisPosition.Right; gdpInvestmentYAxis.Style.LabelStyle.TextAlignment = TKChartAxisLabelAlignment.Left; gdpInvestmentYAxis.Style.MajorTickStyle.TicksHidden = false; gdpInvestmentYAxis.Style.LineHidden = false; chart.AddAxis (gdpInvestmentYAxis); // << chart-axis-position-cs TKChartNumericAxis gdpGrowthUpAnnualChangeYAxis = new TKChartNumericAxis (new NSNumber(-6), new NSNumber(4)); gdpGrowthUpAnnualChangeYAxis.MajorTickInterval = 1; gdpGrowthUpAnnualChangeYAxis.Position = TKChartAxisPosition.Right; gdpGrowthUpAnnualChangeYAxis.Style.LabelStyle.TextAlignment = TKChartAxisLabelAlignment.Left; gdpGrowthUpAnnualChangeYAxis.Style.MajorTickStyle.TicksHidden = false; gdpGrowthUpAnnualChangeYAxis.Style.LineHidden = false; chart.AddAxis (gdpGrowthUpAnnualChangeYAxis); TKChartNumericAxis grossNationalSavingsAnnualGrowthUpYAxis = new TKChartNumericAxis (new NSNumber(0), new NSNumber(16)); grossNationalSavingsAnnualGrowthUpYAxis.MajorTickInterval = 2; grossNationalSavingsAnnualGrowthUpYAxis.Position = TKChartAxisPosition.Right; grossNationalSavingsAnnualGrowthUpYAxis.Style.LabelStyle.TextAlignment = TKChartAxisLabelAlignment.Left; grossNationalSavingsAnnualGrowthUpYAxis.Style.MajorTickStyle.TicksHidden = false; grossNationalSavingsAnnualGrowthUpYAxis.Style.LineHidden = false; chart.AddAxis (grossNationalSavingsAnnualGrowthUpYAxis); NSDate date2001 = DateWithYear (2001, 12, 31); NSDate date2002 = DateWithYear (2002, 12, 31); NSDate date2003 = DateWithYear (2003, 12, 31); NSDate date2004 = DateWithYear (2004, 12, 31); NSDate date2005 = DateWithYear (2005, 12, 31); TKChartDataPoint[] gdpInPounds = new TKChartDataPoint[] { new TKChartDataPoint(date2001, new NSNumber(1200)), new TKChartDataPoint(date2002, new NSNumber(1200)), new TKChartDataPoint(date2003, new NSNumber(1225)), new TKChartDataPoint(date2004, new NSNumber(1300)), new TKChartDataPoint(date2005, new NSNumber(1350)) }; TKChartColumnSeries gdpInPoundsSeries = new TKChartColumnSeries (gdpInPounds); gdpInPoundsSeries.XAxis = periodXAxis; gdpInPoundsSeries.YAxis = gdpInPoundsYAxis; gdpInPoundsSeries.Selection = TKChartSeriesSelection.Series; chart.AddSeries (gdpInPoundsSeries); TKChartDataPoint[] gdpGrowthUpAnnual = new TKChartDataPoint[] { new TKChartDataPoint (date2001, new NSNumber (4)), new TKChartDataPoint (date2002, new NSNumber (3)), new TKChartDataPoint (date2003, new NSNumber (2)), new TKChartDataPoint (date2004, new NSNumber (-5)), new TKChartDataPoint (date2005, new NSNumber (1)) }; float shapeSize = UIDevice.CurrentDevice.UserInterfaceIdiom == UIUserInterfaceIdiom.Phone ? 7 : 17; TKChartLineSeries gdpGrowthUpSeries = new TKChartLineSeries (gdpGrowthUpAnnual); gdpGrowthUpSeries.Style.PointShape = new TKPredefinedShape (TKShapeType.Circle, new SizeF (shapeSize, shapeSize)); gdpGrowthUpSeries.XAxis = periodXAxis; gdpGrowthUpSeries.YAxis = gdpGrowthUpAnnualChangeYAxis; gdpGrowthUpSeries.Selection = TKChartSeriesSelection.DataPoint; gdpGrowthUpSeries.Style.ShapeMode = TKChartSeriesStyleShapeMode.AlwaysShow; chart.AddSeries (gdpGrowthUpSeries); TKChartDataPoint[] grossAnualSavings = new TKChartDataPoint[] { new TKChartDataPoint (date2001, new NSNumber (14)), new TKChartDataPoint (date2002, new NSNumber (8)), new TKChartDataPoint (date2003, new NSNumber (12)), new TKChartDataPoint (date2004, new NSNumber (11)), new TKChartDataPoint (date2005, new NSNumber (16)) }; TKChartLineSeries grossAnualSavingsSeries = new TKChartLineSeries (grossAnualSavings); grossAnualSavingsSeries.Style.PointShape = new TKPredefinedShape (TKShapeType.Circle, new SizeF(shapeSize, shapeSize)); grossAnualSavingsSeries.XAxis = periodXAxis; grossAnualSavingsSeries.YAxis = grossNationalSavingsAnnualGrowthUpYAxis; grossAnualSavingsSeries.Selection = TKChartSeriesSelection.DataPoint; grossAnualSavingsSeries.Style.ShapeMode = TKChartSeriesStyleShapeMode.AlwaysShow; chart.AddSeries (grossAnualSavingsSeries); TKChartDataPoint[] gdpInvestment = new TKChartDataPoint[] { new TKChartDataPoint (date2001, new NSNumber (15)), new TKChartDataPoint (date2002, new NSNumber (13)), new TKChartDataPoint (date2003, new NSNumber (16)), new TKChartDataPoint (date2004, new NSNumber (19)), new TKChartDataPoint (date2005, new NSNumber (15)) }; TKChartLineSeries gdpInvestmentSeries = new TKChartLineSeries (gdpInvestment); gdpInvestmentSeries.Style.PointShape = new TKPredefinedShape (TKShapeType.Circle, new SizeF(shapeSize, shapeSize)); gdpInvestmentSeries.XAxis = periodXAxis; gdpInvestmentSeries.YAxis = gdpInvestmentYAxis; gdpInvestmentSeries.Selection = TKChartSeriesSelection.DataPoint; gdpInvestmentSeries.Style.ShapeMode = TKChartSeriesStyleShapeMode.AlwaysShow; chart.AddSeries (gdpInvestmentSeries); this.setStyles (gdpInPoundsSeries); this.setStyles (grossAnualSavingsSeries); this.setStyles (gdpGrowthUpSeries); this.setStyles (gdpInvestmentSeries); chart.ReloadData (); } public void setStyles(TKChartSeries series) { TKChartPaletteItem item = series.Style.Palette.PaletteItemAtIndex (series.Index); if (series is TKChartColumnSeries && item.Drawables.Length > 1) { NSObject drawable = item.Drawables [2]; if (drawable is TKStroke) { TKStroke stroke = drawable as TKStroke; series.YAxis.Style.LineStroke = new TKStroke (stroke.Fill); } else { series.YAxis.Style.LineStroke = new TKStroke (item.Stroke.Fill); } } else { series.YAxis.Style.LineStroke = new TKStroke(item.Stroke.Fill); } series.YAxis.Style.MajorTickStyle.TicksFill = series.YAxis.Style.LineStroke.Fill; // >> chart-tick-style-clipping-cs series.YAxis.Style.MajorTickStyle.MaxTickClippingMode = TKChartAxisClippingMode.Visible; series.YAxis.Style.MajorTickStyle.MinTickClippingMode = TKChartAxisClippingMode.Visible; // << chart-tick-style-clipping-cs if (series.YAxis.Style.MajorTickStyle.TicksFill is TKSolidFill) { TKSolidFill solidFill = series.YAxis.Style.MajorTickStyle.TicksFill as TKSolidFill; series.YAxis.Style.LabelStyle.TextColor = solidFill.Color; } } public NSDate DateWithYear(int year, int month, int day) { NSCalendar calendar = new NSCalendar (NSCalendarType.Gregorian); NSDateComponents components = new NSDateComponents (); components.Year = year; components.Month = month; components.Day = day; return calendar.DateFromComponents (components); }Regards,
Lance | Tech Support Engineer, Sr.
Telerik by Progress
Do you want to have your say when we set our development plans?
Do you want to know when a feature you care about is added or when a bug fixed?
Explore the
Telerik Feedback Portal
and vote to affect the priority of the items
0

DTC
Top achievements
 Rank 1
answered on 04 Jan 2017, 10:35 AM
Thank you, i have found it