or
5 answers
16.0K+ views
I have a Keno Grid, when first launched, it should be sorted on one column by descending order. How can achieve it? Is there any configuration parameters to set?

1 answer
245 views
Hi,
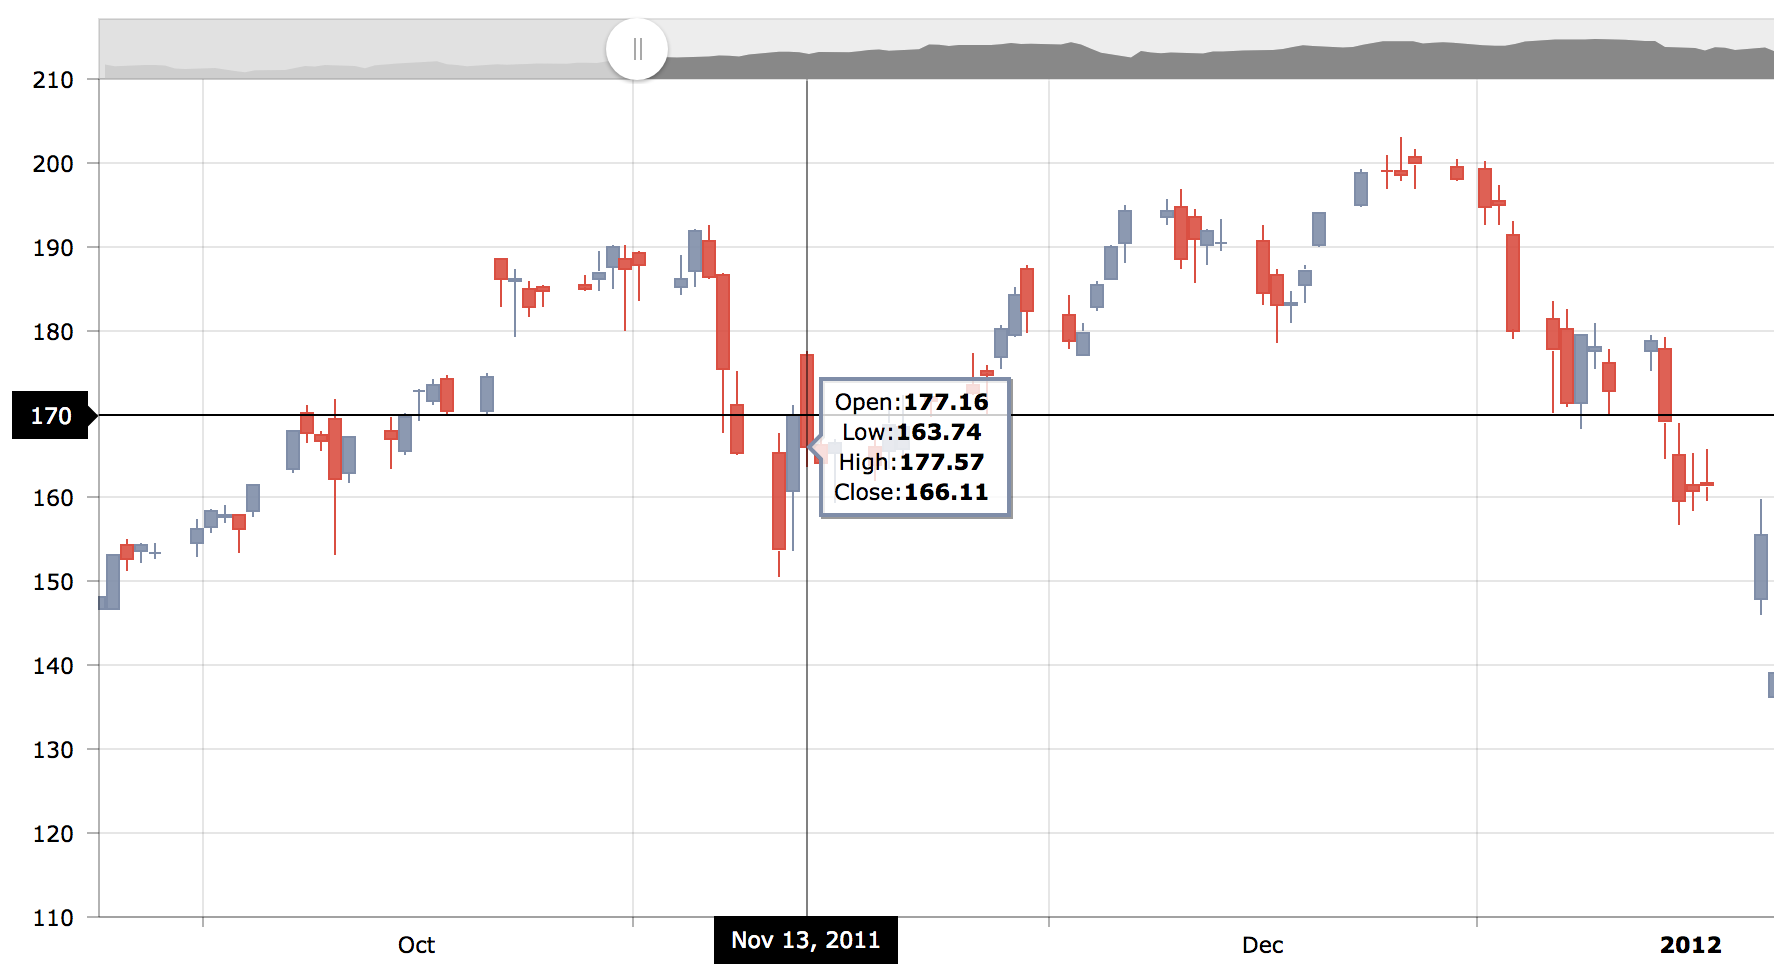
how can I change the position of the Crosshair Tooltip below the chart?
I found https://www.telerik.com/forums/understanding-valueaxis-crosshair and in the dojo is used
valueAxes: [{crosshair: {tooltip: {position:"left",
But I can not find crosshair.tooltip.position in docs
I'm interested in a chart like amchart, see https://www.amcharts.com/demos/candlestick-chart/
Best regards,
Peter

Tsvetina
Telerik team

answered
on
14 Sep 2018
1 answer
96 views
Hello,
First of all I'm using grid which has columns with timepicker, when I click to select time List of hours is displayed but not axactly above or below of it's timepicker but x rows above or below, sometimes It's not event visble on the screen.
I'm creating these grids dynamically which means when I click on something then grid shows up.
Here is my code :
$("#grid-" + shopID).kendoGrid({ dataSource: dataSource, height: 550, sortable: true, pageable: { refresh: true, pageSizes: true, buttonCount: 5 }, columns: [ { title: "Day", field: "scheduleDay", format: "{0:yyyy/MM/dd}", }, { editor: timePicker, format: "{0:HH:mm}", title: "Godzina rozpoczęcia pracy sklepu" }, { editor: timePicker, field: "workEndHour", format: "{0:HH:mm}" } { command: ["edit"], title: " " } ], editable: "inline" });};
I've attached image how is it looks like.
On the top I have some kind of summary grid, where I can pick which Grid to show, the problem occurs only on lowest rows. Have no idea how to make this works.
Preslav
Telerik team
answered
on
14 Sep 2018
6 answers
9.7K+ views
I am using asynchronous file upload, where the user cannot select multiple files. Once the upload has completed successfully, I want to remove the selected file from the display. How can I do this?
I tried
$(".k-upload-files").remove()
it removed the value from the display, but if the user selected another file and tried to upload again, then it would actually post the old file, not the newly selected file.
I also tried
but it did not work
I tried
$(".k-upload-files").remove()
it removed the value from the display, but if the user selected another file and tried to upload again, then it would actually post the old file, not the newly selected file.
I also tried
$("#attachments").parents(".t-upload").find(".t-upload-files").remove() but it did not work
3 answers
141 views
Hello,
I am having a strange problem and cannot find any solution. I have a simple grip in popup:
<script>
function createDepositsTable() {
$("#depositsTable").kendoGrid({
height: 200,
scrollable: true,
dataSource: {
data: depositdata
},
resizable: true,
columns: [
{
field: "TransactionDate",
title: "Date",
type: "date",
headerAttributes: { style: "vertical-align: top;white-space: normal" },
format: "{0:MM-dd-yyyy}",
attributes: { class: "text-left" }
}, {
field: "Value",
title: "Amount",
headerAttributes: { style: "vertical-align: top;white-space: normal" },
format: "{0:c2}",
attributes: { class: "text-right" }
}],
});
console.log(depositdata);
var grid = $("#depositsTable").data("kendoGrid");
grid.bind();
}
Another dropdown selects an account and gets the data. Initially 9 records populated in datasource for grid and they displayed fine. If I select another account, 2 records populated and I can see them in console.log(depositdata); => 2 records, but the grid will display the old ones plus new = 11. Any other selection will just add new records to the end of the grid. I did try re-bind: grid.bind();
re-create:
$(document).ready(createDepositsTable);
$(document).bind("kendo:skinChange", createDepositsTable);
refresh, but nothing helped. Do you have any idea what could be done here?
Thanks.

3 answers
355 views
Hi,
I'm trying to export a grid with a big data to PDF file but I'm constantly having problems with it In Chrome,
it's fail to download a file (Failed - Network error). When i try to download it with Opera or Firefox it downloads without a problem.
What is causing this behavior?

Ivan Danchev
Telerik team
answered
on
13 Sep 2018
5 answers
680 views
In my web app I created a class DataSourceResult
/// <summary> /// DataSource result /// </summary> public class DataSourceResult { /// <summary> /// Extra data /// </summary> public object ExtraData { get; set; } /// <summary> /// Data /// </summary> public IEnumerable Data { get; set; } /// <summary> /// Errors /// </summary> public object Errors { get; set; } /// <summary> /// Total records /// </summary> public int Total { get; set; } }
and in my controller
[HttpPost] [AdminAntiForgery] public IActionResult PortList(DataSourceRequest command) { if (!_permissionService.Authorize(StandardPermissionProvider.ManageVendors)) return AccessDeniedKendoGridJson(); var ports = _worldPortIndexService.GetAllPorts(pageIndex: command.Page - 1, pageSize: command.PageSize); var model = ports.Select(p => { var store = _worldPortIndexService.GetPortById(p.Id); return new PortMainModel { Id = p.Id, PortName = p.PortName, UNLOCODE = p.UNLOCODE, Country = p.Country, LatDec = p.LatDec, LonDec = p.LonDec }; }).ToList(); return Json(new DataSourceResult { Data = model, Total = ports.TotalCount }); }
and my view script is
$(document).ready(function() { $("#ports-grid").kendoGrid({ dataSource: { type: "json", transport: { read: { url: "@Html.Raw(Url.Action("PortList", "PortGuideAdmin"))", type: "POST", dataType: "json", data: addAntiForgeryToken }, destroy: { url: "@Html.Raw(Url.Action("Delete", "PortGuideAdmin"))", type: "POST", dataType: "json", data: addAntiForgeryToken } }, schema: { data: "Data", total: "Total", errors: "Errors", model: { id: "Id" } }, requestEnd: function (e) { if (e.type == "update") { this.read(); } }, error: function(e) { display_kendoui_grid_error(e); // Cancel the changes this.cancelChanges(); }, pageSize: @(defaultGridPageSize), serverPaging: true, serverFiltering: true, serverSorting: true }, pageable: { refresh: true, pageSizes: [@(gridPageSizes)], @await Html.PartialAsync("_GridPagerMessages") }, editable: { confirmation: "@T("Admin.Common.DeleteConfirmation")", mode: "inline" }, scrollable: false, columns: [{ field: "Id", headerTemplate: "<input id='mastercheckbox' type='checkbox'/>", headerAttributes: { style: "text-align:center" }, attributes: { style: "text-align:center" }, template: "<input type='checkbox' value='#=Id#' class='checkboxGroups'/>", width: 50 }, { field: "PortName", width: 200, title: "Port Name" }, { field: "UNLOCODE", width: 100, title: "UNLO CODE" },{ field: "Country", width: 200, title: "Country" }, { field: "LatDec", width: 100, title: "Latitude" },{ field: "LonDec", width: 100, title: "Longitude" }, { field: "Id", title: "@T("Admin.Common.Edit")", width: 100, headerAttributes: { style: "text-align:center" }, attributes: { style: "text-align:center" }, template: '<a class="btn btn-default" href="Edit/#=Id#"><i class="fa fa-pencil"></i>@T("Admin.Common.Edit")</a>' }] });});
when I turn filterable and sortable true filter and sorting is not updating my grid.Grid views list fine. all other functions are working except filtering and sorting.
Konstantin Dikov
Telerik team
answered
on
13 Sep 2018
5 answers
540 views
Hi,
We recently upgraded from 2016 library to latest one. One of the widgets we are using is Chart and we have situation where we display yearly data spread through the weeks.
In previous version we simply had categoryAxis configuration set to
baseUnit: "weeks",
labels: {
step: 1,
dateFormats: {
weeks: "cw"
}
},
majorGridLines: {
visible: true
},
axisCrossingValues: [0, 54]
However, after upgrading to the new version, instead of displaying week numbers (1 to 52) it simply displays cw text.
I tried all possible things i could think of, but couldn't make it display week numbers, so I would appreciate a little help. :)
Thanks


4 answers
7.3K+ views
I have a virtual remote data enabled grid configured like this:
Basically, I would like to refresh the grid, scroll all the way up (usually, this is done by the refresh call) and finally, I would like to select the first row.
I created the following code:
However, the call to the refresh function is executed asynchronously. As the grid datasource is consuming an OData service to load only a subset of data when you scroll up or down, it does make sense.
So even if the call to the refresh function is made before the select call, the displayed row will be updated after the select call and will also remove any row selection in the grid.
I know it could possible to solve this problem by creating some kind of message system that could be handled by the grid's dataBound event, but I would like to know if anyone has a more simple solution for this.
Best regards,
Simon
var myDataSource = new kendo.data.DataSource({ transport: { read: { url: 'http://localhost/MyODataService.asmx', dataType: 'jsonp', data: { $select: 'RecordID, FirstName, LastName' } }, parameterMap: function (data, operation) { if (operation == 'read') { return kendo.data.transports['odata'].parameterMap(data, operation); } else { return JSON.stringify(data.models); } } }, type: 'odata', pageSize: 200, serverPaging: true, serverSorting: true, batch: true});jQueryGrid.kendoGrid({ dataSource: myDataSource height: 530, scrollable: { virtual: true }, reorderable: true, resizable: true, sortable: true, columns: ['RecordID', 'FirstName', 'LastName'], selectable: 'row'});I created the following code:
myGrid.data('kendoGrid').dataSource.read();myGrid.data('kendoGrid').refresh();myGrid.data('kendoGrid').select('tr:eq(0)');So even if the call to the refresh function is made before the select call, the displayed row will be updated after the select call and will also remove any row selection in the grid.
I know it could possible to solve this problem by creating some kind of message system that could be handled by the grid's dataBound event, but I would like to know if anyone has a more simple solution for this.
Best regards,
Simon
2 answers
164 views
Hello
I have noticed an issue when moving from 2017.3.1026 to 2018.1.221 which causes a dropdown with a 'valueTemplate' to be drawn oddly as if it is trying to draw blank line above the value.
I enclose a couple of images of how it looks now and how it looked before.
I have looked at the docs and I cannot see if I need to change the format of the 'valueTemplate'
Any suggestions would be appreciated.
Thanks
James
here is some sample code:
<input id="dropdownlist" />
<script>
$("#dropdownlist").kendoDropDownList({
dataSource: [
{ id: 1, name: "Apples", txtColor: "black", bkgColor: "lightblue" },
{ id: 2, name: "Oranges", txtColor: "black", bkgColor: "slateblue" },
{ id: 3, name: "Pears", txtColor: "black", bkgColor: "lightgreen" }
],
dataTextField: "name",
dataValueField: "id",
template: '<div style="color: #= txtColor #; background-color: #= bkgColor #;">#= name #</div>',
valueTemplate: '<div style="color: #= txtColor #; background-color: #= bkgColor #;">#= name #</div>'
});
</script>
James
Top achievements
 Rank 1
answered
on
12 Sep 2018


