Hello. I'm going to create a special chart in my project. One of the requirements of this particular chart is the possibility of bullet deformation for lines drawn. Is there a possibility to change bullet points on the chart into shapes or images? And is there a possibility to paint several grids?
If this is possible, please provide guidance on how to implement this item?
The image is in the attachment.
If this is possible, please provide guidance on how to implement this item?
The image is in the attachment.
5 Answers, 1 is accepted
0
Hi Bahman,
It is possible to create a similar chart. You can assign a different shape to each series (even point). In addition to the grid, you can add plot band annotations to mark the zones. I have attached a small example to show you how this can be implemented.
I hope this will be useful. Let me know if you have additional questions.
Regards,
Dimitar
Progress Telerik
Try our brand new, jQuery-free Angular components built from ground-up which deliver the business app essential building blocks - a grid component, data visualization (charts) and form elements.
0
Mohsen
Top achievements
 Rank 1
 Rank 1
answered on 23 Apr 2019, 03:20 AM
Hi, is it possible to add another Another Shape Top OF Star And this : > < [ ] triangle ... want to have and Star with that Shapes Top of Also i need to fix X, Y with Exact numbers , -10 - 0-10-20-30-40-50-60-70-80-90-100-110-120 and for Y : 125- 250-500-1000-2000-3000-4000-8000 . but in your Sample it will be change based on New Point Address.and is it possible to put gridlines at Like attached File. Thanks
0
Hello Mohsen,
It is possible to have another shape but you will need to manually draw it. You can check the following article which shows how can override the default drawing mechanism: Custom rendering.
By default the axes range is determined by the data, however, this can be set in the code as well. The following article shows how you can set the minimum/maximum and the step of the axes: Linear Axis.
It is possible to have such lines just set the BorderDashStyle of the grid. Detailed information is available here: Chart Grid.
I hope this will be useful.
Regards,
Dimitar
Progress Telerik
Get quickly onboarded and successful with your Telerik and/or Kendo UI products with the Virtual Classroom free technical training, available to all active customers. Learn More.
0
Mohsen
Top achievements
 Rank 1
 Rank 1
answered on 26 Apr 2019, 05:01 PM
Hi ,
I've Attached a picture to say my words better, please check it.
1-is it possible to add 'AC', 'BC' title in side of the Chart in front of the color
2-is is possible to design horizontal lines like the attached picture and id item 250,500 in the horizontal lines.
3-in some situation AC and BC are in the same , which means in this way border lines will replace each other. so need to put second top of the first line if they ware in the same range.
4-about changing exists shapes with custom shapes check the topics you told me but didn't get .is it possible to use my own picture? or character
0
Hello, Mohsen,
Dimitar is out of office today, so I will be handling this thread for you. Straight to your questions:
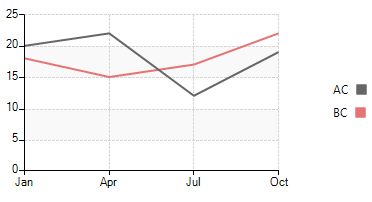
1. In order to switch the title and marker elements in the legend you can handle the ChartElement.LegendElement.VisualItemCreating event and use the following custom legend item element:

2. It is appropriate to use grid line annotations which are lines or circles that cross the chart grid at location on the axis, specified by their Value property. Additional information is available in the following help article: https://docs.telerik.com/devtools/winforms/controls/chartview/features/annotations/grid-line
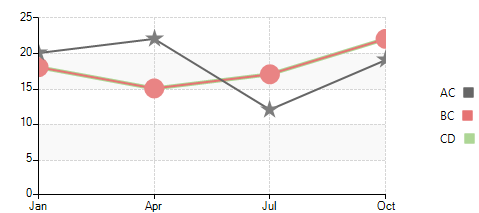
3. If I understand your requirement correctly, you need to indicate that two LineSeries may be completely overlapped. I can suggest you to make the LineSeries with thicker line by setting the BorderWidth property:

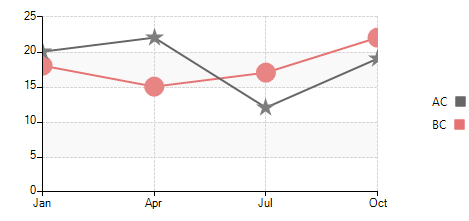
4. You can specify what shape to be used in the LineSeries by setting the LineSeries. Shape property and adjusting the PointSize:

Note that most of the forum threads are reviewed by Telerik representatives and sometimes we address the questions asked by our customers in the forums as well. However, a post in the forum doesn't guarantee you a response from the Telerik support team. This reply was handled by the Telerik support as an exception for you. Moreover, threads are handled according to license and time of posting, so if it is an urgent problem, we suggest you use a support ticket, which would be handled before a forum thread. Thank you for your understanding.
I hope this information helps.
Regards,
Dess | Tech Support Engineer, Sr.
Progress Telerik
Dimitar is out of office today, so I will be handling this thread for you. Straight to your questions:
1. In order to switch the title and marker elements in the legend you can handle the ChartElement.LegendElement.VisualItemCreating event and use the following custom legend item element:
public RadForm1(){ InitializeComponent(); this.radChartView1.ChartElement.LegendElement.VisualItemCreating += LegendElement_VisualItemCreating; LineSeries lineSeries = new LineSeries(); lineSeries.LegendTitle = "AC"; lineSeries.DataPoints.Add(new CategoricalDataPoint(20, "Jan")); lineSeries.DataPoints.Add(new CategoricalDataPoint(22, "Apr")); lineSeries.DataPoints.Add(new CategoricalDataPoint(12, "Jul")); lineSeries.DataPoints.Add(new CategoricalDataPoint(19, "Oct")); this.radChartView1.Series.Add(lineSeries); LineSeries lineSeries2 = new LineSeries(); lineSeries2.LegendTitle = "BC"; lineSeries2.DataPoints.Add(new CategoricalDataPoint(18, "Jan")); lineSeries2.DataPoints.Add(new CategoricalDataPoint(15, "Apr")); lineSeries2.DataPoints.Add(new CategoricalDataPoint(17, "Jul")); lineSeries2.DataPoints.Add(new CategoricalDataPoint(22, "Oct")); this.radChartView1.Series.Add(lineSeries2); this.radChartView1.ShowGrid = true; this.radChartView1.ShowLegend = true;}private void LegendElement_VisualItemCreating(object sender, LegendItemElementCreatingEventArgs e){ e.ItemElement = new CustomLegendItemElement(e.LegendItem);}public class CustomLegendItemElement : LegendItemElement{ public CustomLegendItemElement(LegendItem item) : base(item) { } protected override void CreateChildElements() { base.CreateChildElements(); this.Children.Clear(); this.Children.Add(this.TitleElement); this.Children.Add(this.MarkerElement); }}2. It is appropriate to use grid line annotations which are lines or circles that cross the chart grid at location on the axis, specified by their Value property. Additional information is available in the following help article: https://docs.telerik.com/devtools/winforms/controls/chartview/features/annotations/grid-line
3. If I understand your requirement correctly, you need to indicate that two LineSeries may be completely overlapped. I can suggest you to make the LineSeries with thicker line by setting the BorderWidth property:
LineSeries lineSeries = new LineSeries(); lineSeries.LegendTitle = "AC"; lineSeries.DataPoints.Add(new CategoricalDataPoint(20, "Jan")); lineSeries.DataPoints.Add(new CategoricalDataPoint(22, "Apr")); lineSeries.DataPoints.Add(new CategoricalDataPoint(12, "Jul")); lineSeries.DataPoints.Add(new CategoricalDataPoint(19, "Oct")); this.radChartView1.Series.Add(lineSeries); LineSeries lineSeries2 = new LineSeries(); lineSeries2.LegendTitle = "BC"; lineSeries2.DataPoints.Add(new CategoricalDataPoint(18, "Jan")); lineSeries2.DataPoints.Add(new CategoricalDataPoint(15, "Apr")); lineSeries2.DataPoints.Add(new CategoricalDataPoint(17, "Jul")); lineSeries2.DataPoints.Add(new CategoricalDataPoint(22, "Oct")); this.radChartView1.Series.Add(lineSeries2); LineSeries lineSeries3 = new LineSeries(); lineSeries3.LegendTitle = "CD"; lineSeries3.DataPoints.Add(new CategoricalDataPoint(18, "Jan")); lineSeries3.DataPoints.Add(new CategoricalDataPoint(15, "Apr")); lineSeries3.DataPoints.Add(new CategoricalDataPoint(17, "Jul")); lineSeries3.DataPoints.Add(new CategoricalDataPoint(22, "Oct")); this.radChartView1.Series.Add(lineSeries3); this.radChartView1.ShowGrid = true; this.radChartView1.ShowLegend = true; lineSeries.Shape = new StarShape(); lineSeries.PointSize = new SizeF(20, 20); lineSeries2.Shape = new CircleShape(); lineSeries2.PointSize = new SizeF(20, 20); lineSeries.BorderWidth = 2; lineSeries2.BorderWidth = 2; lineSeries3.BorderWidth = 4;}4. You can specify what shape to be used in the LineSeries by setting the LineSeries. Shape property and adjusting the PointSize:
lineSeries.Shape = new StarShape();lineSeries.PointSize = new SizeF(20, 20);lineSeries2.Shape = new CircleShape();lineSeries2.PointSize = new SizeF(20, 20);Note that most of the forum threads are reviewed by Telerik representatives and sometimes we address the questions asked by our customers in the forums as well. However, a post in the forum doesn't guarantee you a response from the Telerik support team. This reply was handled by the Telerik support as an exception for you. Moreover, threads are handled according to license and time of posting, so if it is an urgent problem, we suggest you use a support ticket, which would be handled before a forum thread. Thank you for your understanding.
I hope this information helps.
Regards,
Dess | Tech Support Engineer, Sr.
Progress Telerik
Get quickly onboarded and successful with your Telerik and/or Kendo UI products with the Virtual Classroom free technical training, available to all active customers. Learn More.


