11 Answers, 1 is accepted
0


Hello,
If you want to change the font only for a single label in the axis, you can access the respective AxisLabelElement via the LinearAxis.Children collection and set the desired Font as it is demonstrated in the code snippet below:
I hope this information helps. If you need any further assistance please don't hesitate to contact me.
Regards,
Dess | Tech Support Engineer, Sr.
Progress Telerik
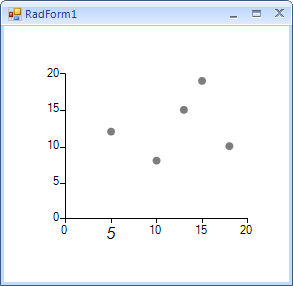
If you want to change the font only for a single label in the axis, you can access the respective AxisLabelElement via the LinearAxis.Children collection and set the desired Font as it is demonstrated in the code snippet below:
ScatterSeries scatterSeries = new ScatterSeries();scatterSeries.Name = "";scatterSeries.DataPoints.Add(new ScatterDataPoint(15, 19));scatterSeries.DataPoints.Add(new ScatterDataPoint(18, 10));scatterSeries.DataPoints.Add(new ScatterDataPoint(13, 15));scatterSeries.DataPoints.Add(new ScatterDataPoint(10, 8));scatterSeries.DataPoints.Add(new ScatterDataPoint(5, 12));scatterSeries.PointSize = new SizeF(8, 8);this.radChartView1.Series.Add(scatterSeries);LinearAxis horizontalAxis = radChartView1.Axes.Get<LinearAxis>(0);AxisLabelElement axisLabel = horizontalAxis.Children[1] as AxisLabelElement;axisLabel.Font = new Font("Arial",12f, FontStyle.Italic);I hope this information helps. If you need any further assistance please don't hesitate to contact me.
Regards,
Dess | Tech Support Engineer, Sr.
Progress Telerik
Get quickly onboarded and successful with your Telerik and/or Kendo UI products with the Virtual Classroom free technical training, available to all active customers. Learn More.
0

asghar
Top achievements
 Rank 1
answered on 29 Dec 2018, 06:00 AM
0
Hello,
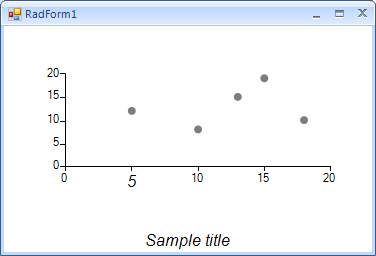
According to the provided screenshot, it seems that you want to change the font for the title of the entire RadChartView which is located at the bottom. You can use the following code snippet:
I hope this information helps.
Regards,
Dess | Tech Support Engineer, Sr.
Progress Telerik
According to the provided screenshot, it seems that you want to change the font for the title of the entire RadChartView which is located at the bottom. You can use the following code snippet:
this.radChartView1.ShowTitle = true;this.radChartView1.Title = "Sample title";this.radChartView1.ChartElement.TitlePosition = TitlePosition.Bottom;this.radChartView1.ChartElement.TitleElement.TextAlignment = ContentAlignment.MiddleCenter;this.radChartView1.ChartElement.TitleElement.Font = new Font("Arial",12f, FontStyle.Italic);I hope this information helps.
Regards,
Dess | Tech Support Engineer, Sr.
Progress Telerik
Get quickly onboarded and successful with your Telerik and/or Kendo UI products with the Virtual Classroom free technical training, available to all active customers. Learn More.
0
asghar
Top achievements
Rank 1
answered on 01 Jan 2019, 06:23 AM
tnx
but i want change the font title of axis x and axis y.
0
Hello,
Thank you for specifying that you need to change the font of the horizontal axis. It was not easy to understand what is the exact requirement that you have from the previous replies.
In order to achieve it, you can use the following code snippet:
I hope this information helps.
Regards,
Dess | Tech Support Engineer, Sr.
Progress Telerik
Thank you for specifying that you need to change the font of the horizontal axis. It was not easy to understand what is the exact requirement that you have from the previous replies.
In order to achieve it, you can use the following code snippet:
LinearAxis horizontalAxis = radChartView1.Axes.Get<LinearAxis>(0);horizontalAxis.Title = "Axis' title";horizontalAxis.Font= new Font("Arial",12f, FontStyle.Italic);I hope this information helps.
Regards,
Dess | Tech Support Engineer, Sr.
Progress Telerik
Get quickly onboarded and successful with your Telerik and/or Kendo UI products with the Virtual Classroom free technical training, available to all active customers. Learn More.
0
0
asghar
Top achievements
Rank 1
answered on 03 Feb 2019, 08:24 AM
hi
at the end,i did it
radChart1.Axes[0].TitleElement.Font= new Font("Arial", 15, FontStyle.Bold);0
asghar
Top achievements
Rank 1
answered on 03 Feb 2019, 08:26 AM
Finally, I did it
radChart1.Axes[0].TitleElement.Font= new Font("Arial, 15, FontStyle.Bold);0
Brandon
Top achievements
Rank 1
answered on 04 Feb 2019, 06:21 PM
I converted:
LinearAxis horizontalAxis = radChartView1.Axes.Get<LinearAxis>(0);horizontalAxis.Title = "Axis' title";horizontalAxis.Font= new Font("Arial",12f, FontStyle.Italic);
to:
Dim HA As LinearAxis = DashBoard.chtNewDayAvg.Axes.[Get](Of LinearAxis)(0)Dim AL As AxisLabelElement = DirectCast(HA.Children(1), AxisLabelElement)AL.ForeColor = Color.WhiteIf RecHasData(Counts) Then 'Play with the 30 day rolling avg. DashBoard.chtNewDayAvg.ShowLegend = False DashBoard.chtNewDayAvg.Series(0).DataPoints.Clear() 'Not sure about the areas For I As Integer = 0 To UB(Counts) Dim Statuses As New List(Of String) Statuses.AddRange(Split(GetFromSet(Counts, 1, I), Separator2)) Dim AssetsDown As Integer = 0 For II As Integer = 0 To Statuses.Count - 1 Dim Val As Integer Integer.TryParse(Statuses(II).Split(Separator)(AssetTypeSlot), Val) Select Case Statuses(II).Split(Separator)(0) Case "Down" AssetsDown += Val : If Val > MaxDwn Then MaxDwn = Val Case "Repairing" AssetsDown += Val : If Val > MaxDwn Then MaxDwn = Val End Select Next Dim DT As String = FMDB(GetFromSet(Counts, 0, I), False).ToShortDateString Dim P As New CategoricalDataPoint(AssetsDown, DT) P.Label = AssetsDown DashBoard.chtNewDayAvg.Series(0).DataPoints.Add(P) Next Dim HA As LinearAxis = DashBoard.chtNewDayAvg.Axes.[Get](Of LinearAxis)(0) Dim AL As AxisLabelElement = DirectCast(HA.Children(0), AxisLabelElement) AL.ForeColor = Color.WhiteEnd IfHA is nothing, so I get an Object Reference error on the second line where it tries to get the children.
You example was to adjust the font for a specific horizontal label. I just want to set the ForeColor for all of them. This is the code I'm using to populate the Graph with data.
0
Brandon
Top achievements
Rank 1
answered on 04 Feb 2019, 07:59 PM
Nevermind. Set the forecolor using this:
DashBoard.chtNewDayAvg.Series(0).Axes(0).ForeColor = Color.WhiteDashBoard.chtNewDayAvg.Series(0).Axes(1).ForeColor = Color.White
0
Hello,
I am glad that the problem you were facing is now resolved. Feel free to access the axis after RadChartView is populated with points. Then, it is not supposed to be null.
Note that if you want to customize the labels in the axis, you can access the respective AxisLabelElement via the LinearAxis.Children collection apply the desired style.
Feel free to use our online converter for translating C# to VB.NET and vice versa: http://converter.telerik.com/
Should you have further questions please let me know.
Regards,
Dess | Tech Support Engineer, Sr.
Progress Telerik
Get quickly onboarded and successful with your Telerik and/or Kendo UI products with the Virtual Classroom free technical training, available to all active customers. Learn More.