Hello,
is it somehow possible to bind a chart at a list of dynamic objects or at a dictionary? Because I have a dictionary which contains different types of data (y-axis: numerical data, x-axis: timestamps) and I want to bind e.g. a line chart with two different series (or more) to this dictionary. I know I could split the different types of data into lists and bind them to the chart. But the data can contain an unspecified number of different types of data and I want to dynmically bind and create the chart and its series without having different list-properies inside my viewmodel, which would not fulfill my needs.
Many thanks in advance.
Kind regards,
Felix
3 Answers, 1 is accepted


At this time, dynamic getters are not supported for value type. Therefore you will need to split the data up into lists that you can directly assign to the series' ItemsSource. Additionally, you may also need to determine what the type is so that you can create the appropriate axis for that given type (e.g. ScatterSeries uses two numerical axes, where as a BarSeries typically uses one numerical and one categorical).
However, you can use LINQ to easily group the items in the dictionary by type. Once you have the groups, create a series ItemsSource Chart for each one. I have created a simple example to illustrate the approach, below are the highlights
Demo
Here's the runtime result from the example below:
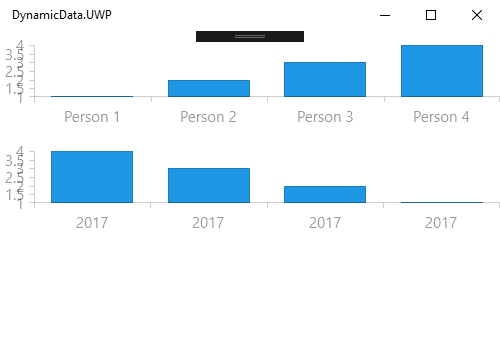
I have the page with a single StackLayout:
<ContentPage ...> <StackLayout x:Name="myStackLayout"/></ContentPage>Here's the code-behind. In it I created the following Dictionary<dynamic, double> sample data and then build the Chart after grouping the data by type:
namespace DynamicData{ public partial class MainPage : ContentPage { private Dictionary<object, double> dict; public MainPage() { InitializeComponent(); CreateData(); CreateChartsUsingLinq(); } private void CreateData() { dict = new Dictionary<dynamic, double>(); for (int i = 1; i < 5; i++) { // an item that could be rendered on a Categorical Axis dict.Add($"Person {i}", i); // an item that could be rendered on a DateTime Axis dict.Add(DateTime.Now.AddDays(-i), i); } } private void CreateChartsUsingLinq() { var groups = dict.GroupBy(x=>x.Key.GetType()); var dataLists = new List<MySeriesDataSource>(); // iterate over the groups to create a chart data source foreach (var group in groups) { var seriesDataSource = new MySeriesDataSource { CategoryType = group.Key.ToString(), Items = new List<ChartData>() }; // iterate over the group's dictionary and get out the series data foreach (var keyValuePair in group) { seriesDataSource.Items.Add(new ChartData { Category = keyValuePair.Key, Value = keyValuePair.Value }); } dataLists.Add(seriesDataSource); } // Now we can create the chart(s) by iterating over the List foreach (var seriesDataSource in dataLists) { var chart = new RadCartesianChart(); chart.VerticalAxis = new NumericalAxis(); // determine what kind of horizontal axis you need if (seriesDataSource.CategoryType == "System.String") { chart.HorizontalAxis = new CategoricalAxis(); } else if (seriesDataSource.CategoryType == "System.DateTime") { chart.HorizontalAxis = new DateTimeContinuousAxis(); } // Create the series and set the bindings var barSeries = new BarSeries(); barSeries.CategoryBinding = new PropertyNameDataPointBinding("Category"); barSeries.ValueBinding = new PropertyNameDataPointBinding("Value"); // Use the data barSeries.ItemsSource = seriesDataSource.Items.ToList(); chart.Series.Add(barSeries); // Add the chart to the UI myStackLayout.Children.Add(chart); } } }}Regards,
Lance | Tech Support Engineer, Sr.
Progress Telerik

Hello Lance,
thanks for your fast answer. It was very helpful.
Kind regards,
Felix
Hello Lance,
Thank for the solution and got some idea about how to create Multiseries chart or clustor.
Thanks
praveen