I'm trying to figure out how to create some padding inside the coordinate space of the chart. Things I have done:
Set categorical axis axisplotmode to OnTicksPadded
Increased Padding on Chart.View.Margins (this seems to be the padding between the chart itself and stuff outside the chart)
See the picture below for an example. Basically datapoints aren't fully displaying because the points are being cutoff because the last Y-axis Tick is literally at the same Y location as the top of the chart. I'd like to move it down a bit to give the datapoints some space. Essentially create extra space around the edges of the axes. I have one axes that's a categorical axis and one that's a linear axis.
4 Answers, 1 is accepted
0


Hello, Michael,
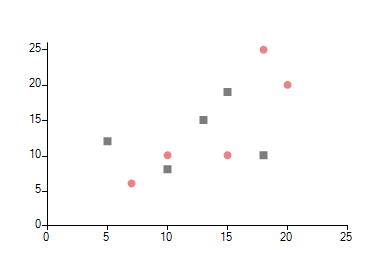
If the maximum value of the axis overlaps with the value of one of the data points the point is clipped. By default, the axis is adjusted to include some bigger values in order to avoid such trimming. However, it seems that you limit the available maximum to the maximum value for the data points. The LinearAxis offers the ClipLabels property in order to avoid trimming. As to the data points, I can suggest you specify the maximum of the axis to a value slightly greater than the maximum data value. Here is a sample code snippet and a screenshot for better illustration:
I hope this information helps. If you have any additional questions, please let me know.
Regards,
Dess
Progress Telerik
If the maximum value of the axis overlaps with the value of one of the data points the point is clipped. By default, the axis is adjusted to include some bigger values in order to avoid such trimming. However, it seems that you limit the available maximum to the maximum value for the data points. The LinearAxis offers the ClipLabels property in order to avoid trimming. As to the data points, I can suggest you specify the maximum of the axis to a value slightly greater than the maximum data value. Here is a sample code snippet and a screenshot for better illustration:
public RadForm1(){ InitializeComponent(); ScatterSeries scatterSeries = new ScatterSeries(); scatterSeries.Name = ""; scatterSeries.DataPoints.Add(new ScatterDataPoint(15, 19)); scatterSeries.DataPoints.Add(new ScatterDataPoint(18, 10)); scatterSeries.DataPoints.Add(new ScatterDataPoint(13, 15)); scatterSeries.DataPoints.Add(new ScatterDataPoint(10, 8)); scatterSeries.DataPoints.Add(new ScatterDataPoint(5, 12)); scatterSeries.PointSize = new SizeF(8, 8); this.radChartView1.Series.Add(scatterSeries); ScatterSeries scatterSeries2 = new ScatterSeries(); scatterSeries2.Name = ""; scatterSeries2.DataPoints.Add(new ScatterDataPoint(20, 20)); scatterSeries2.DataPoints.Add(new ScatterDataPoint(15, 10)); scatterSeries2.DataPoints.Add(new ScatterDataPoint(7, 6)); scatterSeries2.DataPoints.Add(new ScatterDataPoint(18, 25)); scatterSeries2.DataPoints.Add(new ScatterDataPoint(10, 10)); scatterSeries2.PointSize = new SizeF(8, 8); scatterSeries.Shape = new RoundRectShape(0); this.radChartView1.Series.Add(scatterSeries2); LinearAxis verticalAxis = scatterSeries.VerticalAxis as LinearAxis; if (verticalAxis != null) { verticalAxis.Maximum = 26; verticalAxis.ClipLabels = false; }}I hope this information helps. If you have any additional questions, please let me know.
Regards,
Dess
Progress Telerik
Try our brand new, jQuery-free Angular components built from ground-up which
deliver the business app essential building blocks - a grid component,
data visualization (charts) and form elements.
0

Zim
Top achievements
 Rank 1
answered on 20 Sep 2018, 04:21 PM
My doubt is, if the padding are like inner-margins, they are part of the element, wouldn't it be supposed to be counted inside that 50% width? In other words, I want the element + the padding to be 50%, not just the element.
0
Zim
Top achievements
Rank 1
answered on 20 Sep 2018, 04:21 PM
My doubt is, if the padding are like inner-margins, they are part of the element, wouldn't it be supposed to be counted inside that 50% width? In other words, I want the element + the padding to be 50%, not just the element.
0
Hello, Zim,
Considering the rendering mechanism of RadChartView, it is possible to adjust the Margin for the RadChartView.View element. It controls how far the chart area together with the axis and data points are displayed from the top left corner of the control itself. As to the data point elements, they can be shifted by the axis values, specify minimum/maximum, the step, etc. The main properties that can be modified are listed in the following help article: https://docs.telerik.com/devtools/winforms/chartview/axes/axes
I hope this information helps. If you need any further assistance please don't hesitate to contact me.
Regards,
Dess
Progress Telerik
Get quickly onboarded and successful with your Telerik and/or Kendo UI products with the Virtual Classroom free technical training, available to all active customers. Learn More.