Axes
Axis Object and Its Properties
The axes of the chart are contained in two objects of type AxisGroup. You can access the two collections through the PrimaryAxes and SecondaryAxes properties of the DocumentChart object. Each of the collections contains two axes, stored in the CategoryAxis and ValueAxis properties. The PrimaryAxes property is populated on creation when the constructor of FloatingChartShape or the Add() method of the ChartCollection are used, and you can replace or edit it as desired.
If the SeriesGroup object implements the ISupportAxes interface, it can indicate whether it is associated with the Primary or Secondary couple of axes. For example, the bar and line chart groups implement the interface, while the pie group does not. The ISupportAxes interface defines one property: AxisGroupName, of type AxisGroupName. The AxisGroupName enum has two members: Primary and Secondary.
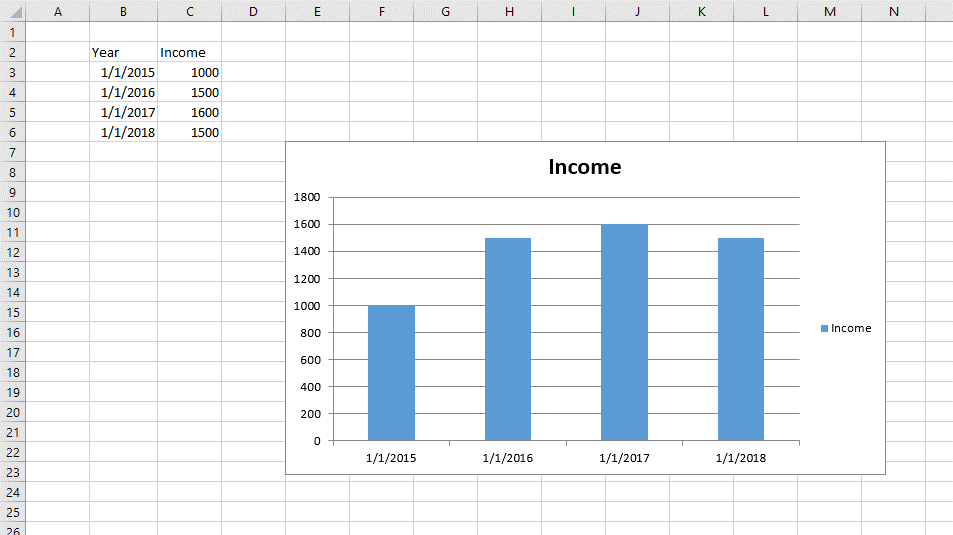
Refer to the scenario from Figure 1. The chart shown there has two axes: a date (horizontal, category) axis and a value (vertical, value) axis. The respective objects can be found in the PrimaryAxes property of the chart. The BarSeriesGroup object AxisGroupName property has value AxisGroupName.Primary. The properties of the axes are listed in Example 1.
Figure 1: Column chart with yearly income values and primary axes
Example 1: Inspect chart axis properties
DocumentChart chart = new FloatingChartShape(worksheet, new CellIndex(0, 0), new CellRange(1, 1, 5, 2), ChartType.Column).Chart;

DateAxis dateAxis = chart.PrimaryAxes.CategoryAxis as DateAxis;
ValueAxis valAxis = chart.PrimaryAxes.ValueAxis as ValueAxis;

ISupportAxes chartComponentWithAxes = chart.SeriesGroups.First() as ISupportAxes;
AxisGroupName axisGroup = chartComponentWithAxes.AxisGroupName; // Primary

bool dateIsVisible = dateAxis.IsVisible; // true
bool valIsVisible = valAxis.IsVisible; // true

double? dateMin = dateAxis.Min; // 1
double? dateMax = dateAxis.Max; // 4

double? valMin = valAxis.Min; // 0
double? valMax = valAxis.Max; // 1800
Changing the Axis of a Chart
RadSpreadProcessing allows you to replace the axis of a chart with a new object. This is achieved through the PrimaryAxes and SecondaryAxes properties of DocumentChart.
Example 2: Replace a chart axis
DocumentChart chart = new FloatingChartShape(worksheet, new CellIndex(0, 0), new CellRange(1, 1, 5, 2), ChartType.Column).Chart;
chart.PrimaryAxes.CategoryAxis = new DateAxis();
Changing the Appearance of the Axes
You can customize the way the axes in the chart look. The API of SpreadProcessing enables you to change the fill and width of the outline of an axis and its major gridlines.
Example 3: Customize axis gridlines and outline
FloatingChartShape chartShape = new FloatingChartShape(workbook.ActiveWorksheet, new CellIndex(2, 7), new CellRange(0, 0, 4, 3), ChartType.Column)
{
    Width = 480,
    Height = 288,
};
chartShape.Chart.PrimaryAxes.ValueAxis.Outline.Fill = new SolidFill(new ThemableColor(Colors.Blue));
chartShape.Chart.PrimaryAxes.ValueAxis.Outline.Width = 5;

chartShape.Chart.PrimaryAxes.ValueAxis.MajorGridlines.Outline.Fill = new SolidFill(new ThemableColor(Colors.LightGray));
chartShape.Chart.PrimaryAxes.ValueAxis.MajorGridlines.Outline.Width = 2;
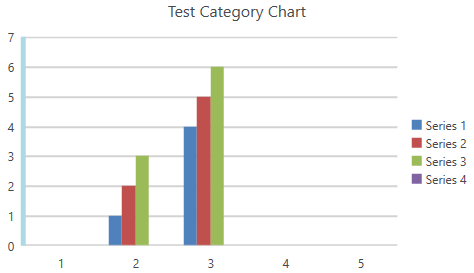
Chart with customized axis outline and major gridlines