New to Telerik UI for ASP.NET MVC? Start a free 30-day trial
Logarithmic Axis
Updated on Dec 11, 2025
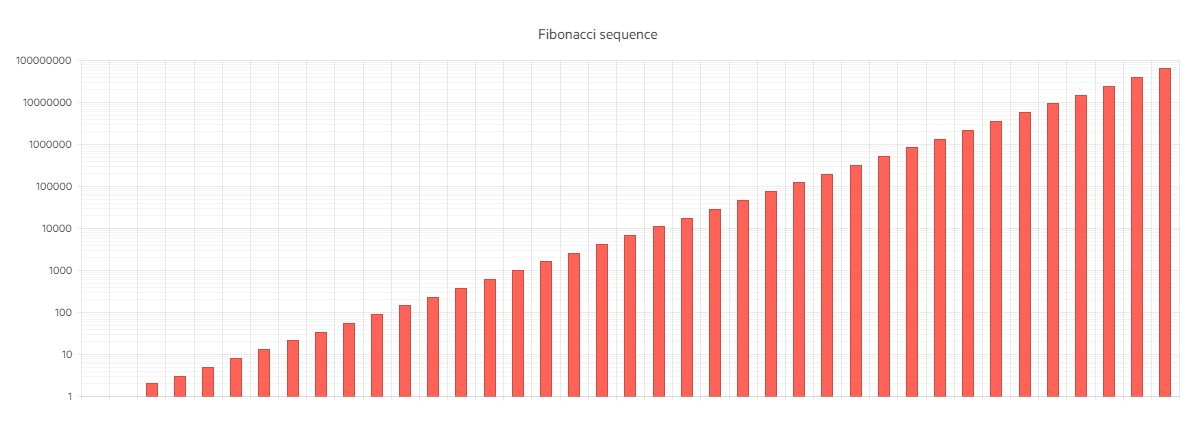
A logarithmic axis is a special numeric axis that transforms the actual values by using a logarithmic function with a particular base. A logarithmic axis is useful for displaying values that cover different orders of magnitude because it lets large values display together with small values in a more condensed scale than the default linear axis.
This demo shows how you can use a logarithmic axis for the ASP.NET Core Column Chart by setting the ValueAxis -> Logarithmic() method.
The following implementation demonstrates the code needed for setting the Date Axis for Bar Chart:
Razor
 @model IEnumerable<int>

<div class="demo-section k-content wide">
    @(Html.Kendo().Chart()
        .Name("chart")
        .Title("Fibonacci sequence")
        .Series(series => {
            series.Column(Model);
        })
        .ValueAxis(axis => axis.Logarithmic()
            .MinorGridLines(minorGridLines => minorGridLines.Visible(true))
        )
        .Tooltip(tooltip => tooltip
            .Visible(true)
        )
    )
</div>Overview of setting the Logarithmic Axis representing the Fibonacci Sequence: