New to Telerik UI for WinUI? Start a free 30-day trial
Radar Area Series
Updated on Mar 26, 2026
When using a RadarAreaSeries the data points are connected with straight line segments that enclose an area that may be optionally stroked and/or filled.
Properties
RadarAreaSeries class inherits from the RadarLineSeries class -
- Fill (Brush): Gets or sets the Brush that defines the interior of the area.
Example
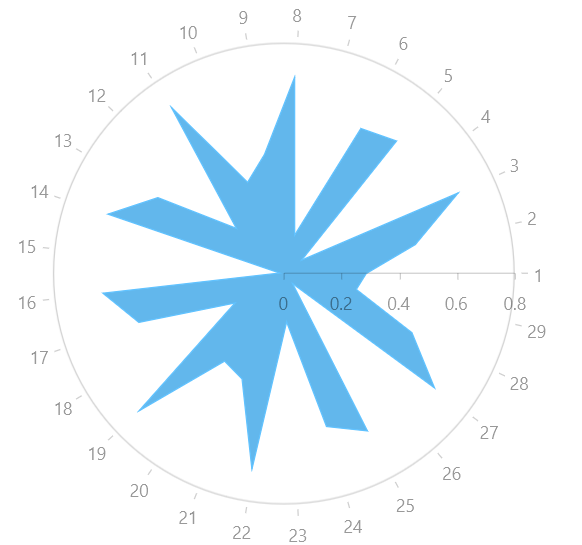
Examples 1 and 2 show how to create a RadPolarChart with a RadarAreaSeries.
Example 1: Defining the model and populating with data
C#
public sealed partial class MainPage : Page
{
	public MainPage()
	{
		this.InitializeComponent();

		List<Data> data = new List<Data>();
		for (double i = 1; i < 30; i += 1)
		{
			data.Add(new Data() { Category = i, Value = ((0.7) * Math.Cos(20 * i)) });
		}

		this.polarChart.DataContext = data;
	}
}

public class Data
{
	public double Value { get; set; }

	public double Category { get; set; }
}
Example 2: Defining the RadPolarChart and RadarAreaSeries
XAML
 <Grid xmlns:telerikChart="using:Telerik.UI.Xaml.Controls.Chart">
	<telerikChart:RadPolarChart x:Name="polarChart">
		<telerikChart:RadPolarChart.PolarAxis>
			<telerikChart:PolarAxis />
		</telerikChart:RadPolarChart.PolarAxis>
		<telerikChart:RadPolarChart.RadialAxis>
			<telerikChart:CategoricalRadialAxis/>
		</telerikChart:RadPolarChart.RadialAxis>

		<telerikChart:RadarAreaSeries ItemsSource="{Binding}">
			<telerikChart:RadarAreaSeries.ValueBinding>
				<telerikChart:PropertyNameDataPointBinding PropertyName="Value"/>
			</telerikChart:RadarAreaSeries.ValueBinding>
			<telerikChart:RadarAreaSeries.CategoryBinding>
				<telerikChart:PropertyNameDataPointBinding PropertyName="Category"/>
			</telerikChart:RadarAreaSeries.CategoryBinding>
		</telerikChart:RadarAreaSeries>
	</telerikChart:RadPolarChart>
</Grid>
Figure 1: RadPolarChart and RadarAreaSeries