New to Telerik UI for WinUI? Start a free 30-day trial
Radar Point Series
Updated on Mar 26, 2026
The RadarPointSeries are displayed on the chart as unconnected data points presented by an arbitrary Template.
Properties
RadarPointSeries class inherits from the PolarSeries class -
- DataPoints: Gets the collection of data points associated with the series.
- CategoryBinding: Gets or sets the binding that will be used by the Category property of the contained CategoricalDataPointBase in the DataPoints collection.
- CombineMode: Gets or sets the combination mode to be used when data points are plotted.
- StackGroupKey: Gets or sets the key that defines in which stack group this series will be included, if its CombineMode property is set to Stack or Stack100.
Example
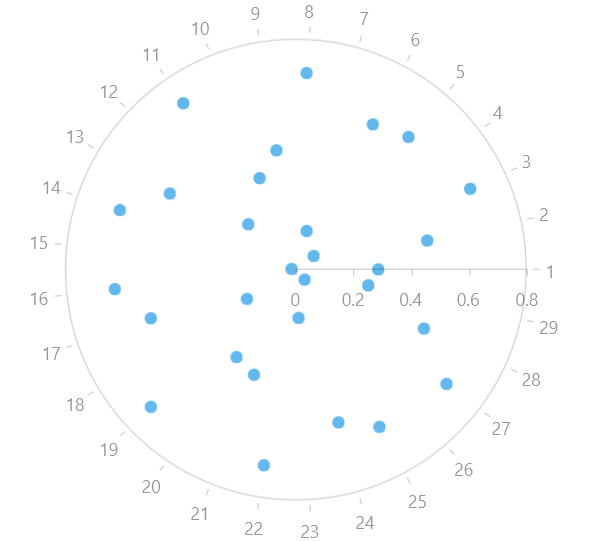
Examples 1 and 2 show how to create a RadCartesianChart with a RadarPointSeries.
Example 1: Defining the model and populating with data
C#
public sealed partial class MainPage : Page
{
	public MainPage()
	{
		this.InitializeComponent();

		List<Data> data = new List<Data>();
		for (double i = 1; i < 30; i += 1)
		{
			data.Add(new Data() { Category = i, Value = ((0.7) * Math.Cos(20 * i)) });
		}

		this.polarChart.DataContext = data;
	}
}

public class Data
{
	public double Value { get; set; }

	public double Category { get; set; }
}
Example 2: Defining the RadPolarChart and RadarPointSeries
XAML
<Grid xmlns:telerikChart="using:Telerik.UI.Xaml.Controls.Chart">
	<telerikChart:RadPolarChart x:Name="polarChart">
		<telerikChart:RadPolarChart.PolarAxis>
			<telerikChart:PolarAxis/>
		</telerikChart:RadPolarChart.PolarAxis>
		<telerikChart:RadPolarChart.RadialAxis>
			<telerikChart:CategoricalRadialAxis/>
		</telerikChart:RadPolarChart.RadialAxis>

		<telerikChart:RadarPointSeries ItemsSource="{Binding}">
			<telerikChart:RadarPointSeries.ValueBinding>
				<telerikChart:PropertyNameDataPointBinding PropertyName="Value"/>
			</telerikChart:RadarPointSeries.ValueBinding>
			<telerikChart:RadarPointSeries.CategoryBinding>
				<telerikChart:PropertyNameDataPointBinding PropertyName="Category"/>
			</telerikChart:RadarPointSeries.CategoryBinding>
		</telerikChart:RadarPointSeries>
	</telerikChart:RadPolarChart>
</Grid>
Figure 1: RadPolarChart and RadarPointSeries