New to Telerik UI for WinUI? Start a free 30-day trial
Polar Area Series
Updated on Mar 26, 2026
When using PolarAreaSeries the data points are connected with straight line segments that enclose an area which may be optionally stroked and/or filled.
Properties
PolarAreaSeries class inherits from the PolarLineSeries class - See the inherited properties.
- Fill (Brush): Gets or sets the Brush that defines the interior of the area.
Example
Examples 1 and 2 show how to create a RadCartesianChart with PolarAreaSeries.
Example 1: Defining the model and populating with data
C#
public sealed partial class MainPage : Page
{
	public MainPage()
	{
		this.InitializeComponent();

		double a = 0.5;
		var b = (Math.PI / 180);
		List<Data> data = new List<Data>();
		for (int i = 1; i < 5 * 360; i += 10)
		{
			data.Add(new Data() { Angle = i, Value = (a * Math.Cos(20 * i * b)) });
		}

		this.polarChart.DataContext = data;
	}
}

public class Data
{
	public double Value { get; set; }

	public double Angle { get; set; }
}
Example 2: Defining the RadPolarChart and PolarAreaSeries
XAML
<Grid xmlns:telerikChart="using:Telerik.UI.Xaml.Controls.Chart">
<telerikChart:RadPolarChart x:Name="polarChart">
<telerikChart:RadPolarChart.PolarAxis>
<telerikChart:PolarAxis/>
</telerikChart:RadPolarChart.PolarAxis>
<telerikChart:RadPolarChart.RadialAxis>
<telerikChart:NumericalRadialAxis/>
</telerikChart:RadPolarChart.RadialAxis>
<telerikChart:PolarAreaSeries ItemsSource="{Binding}">
<telerikChart:PolarAreaSeries.ValueBinding>
<telerikChart:PropertyNameDataPointBinding PropertyName="Value"/>
</telerikChart:PolarAreaSeries.ValueBinding>
<telerikChart:PolarAreaSeries.AngleBinding>
<telerikChart:PropertyNameDataPointBinding PropertyName="Angle"/>
</telerikChart:PolarAreaSeries.AngleBinding>
</telerikChart:PolarAreaSeries>
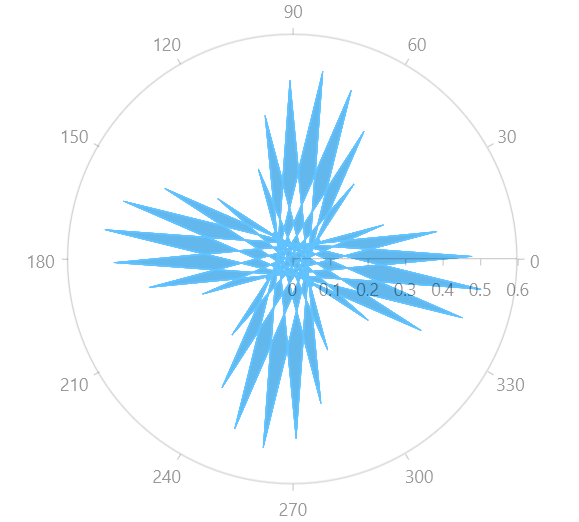
</telerikChart:RadPolarChart>
</Grid>Figure 1: RadPolarChart and PolarAreaSeries