New to Telerik UI for WinUI? Start a free 30-day trial
Polar Line Series
Updated on Mar 26, 2026
The PolarLineSeries are represented on the chart as data points connected with straight line segments.
Properties
The PolarLineSeries class inherits from the PolarPointSeries class -
- Stroke (Brush): Gets or sets the Brush instance that defines the stroke of the Line shape that presents the series.
- StrokeThickness (double): Gets or sets the thickness of the line used to present the series.
- IsClosed (bool): Gets or sets a value indicating whether the Line shape will be closed (by connecting the last point to the first one). The default value is true.
- AutoSortPoints (bool): Gets or sets a value indicating whether the data points associated with the series will be automatically sorted by their Angle property in ascending order. The default value is true.
Example
Examples 1 and 2 demonstrate how to create a RadCartesianChart with a PolarLineSeries.
Example 1: Defining the model and populating with data
C#
public sealed partial class MainPage : Page
{
public MainPage()
{
this.InitializeComponent();
double a = 0.5;
var b = (Math.PI / 180);
List<Data> data = new List<Data>();
for (int i = 1; i < 5 * 360; i += 10)
{
data.Add(new Data() { Angle = i, Value = (a * Math.Cos(20 * i * b)) });
}
this.polarChart.DataContext = data;
}
}
public class Data
{
public double Value { get; set; }
public double Angle { get; set; }
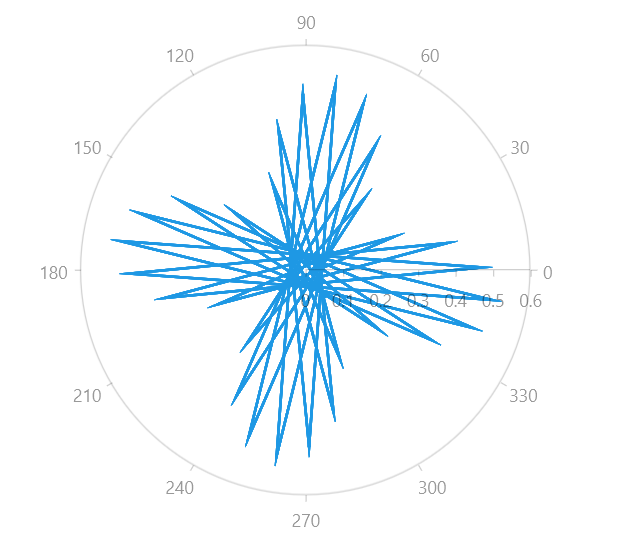
}Example 2: Defining the RadPolarChart and PolarLineSeries
XAML
<Grid xmlns:telerikChart="using:Telerik.UI.Xaml.Controls.Chart">
	<telerikChart:RadPolarChart x:Name="polarChart">
		<telerikChart:RadPolarChart.PolarAxis>
			<telerikChart:PolarAxis/>
		</telerikChart:RadPolarChart.PolarAxis>
		<telerikChart:RadPolarChart.RadialAxis>
			<telerikChart:NumericalRadialAxis/>
		</telerikChart:RadPolarChart.RadialAxis>

		<telerikChart:PolarLineSeries ItemsSource="{Binding}">
			<telerikChart:PolarLineSeries.ValueBinding>
				<telerikChart:PropertyNameDataPointBinding PropertyName="Value"/>
			</telerikChart:PolarLineSeries.ValueBinding>
			<telerikChart:PolarLineSeries.AngleBinding>
				<telerikChart:PropertyNameDataPointBinding PropertyName="Angle"/>
			</telerikChart:PolarLineSeries.AngleBinding>
		</telerikChart:PolarLineSeries>
	</telerikChart:RadPolarChart>
</Grid>
Figure 1: RadPolarChart and PolarLineSeries