New to Telerik UI for WinUI? Start a free 30-day trial
Point Series
Updated on Mar 26, 2026
PointSeries represents its DataPoints as Ellipses.
Properties
PointSeries class inherits from the CategoricalSeriesBase class - See the inherited properties.
- PointSize: Gets or sets the Size of the points. This property will be ignored, if PointTemplate property is set.
- LegendTitleBinding: Gets or sets the binding that will be used by any attached legend to display a legend item title.
- PaletteMode: Gets or sets whether the chart palette will be applied on a per series or per datapoint basis. The available values are:
- Series: Applies the palette on a per series basis.
- DataPoint: Applies the palette on a per point basis.
Example
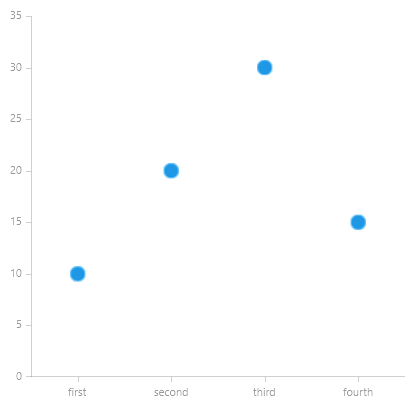
Examples 1 shows how to create a RadCartesianChart with a PointSeries.
Example 1: Defining the PointSeries
XAML
<Grid xmlns:telerikChart="using:Telerik.UI.Xaml.Controls.Chart"
	  xmlns:telerikCharting="using:Telerik.Charting">
	<telerikChart:RadCartesianChart>
		<telerikChart:RadCartesianChart.HorizontalAxis>
			<telerikChart:CategoricalAxis/>
		</telerikChart:RadCartesianChart.HorizontalAxis>
		<telerikChart:RadCartesianChart.VerticalAxis>
			<telerikChart:LinearAxis/>
		</telerikChart:RadCartesianChart.VerticalAxis>

		<telerikChart:PointSeries  PointSize="15,15">
			<telerikCharting:CategoricalDataPoint Category="first" Value="10"/>
			<telerikCharting:CategoricalDataPoint Category="second" Value="20"/>
			<telerikCharting:CategoricalDataPoint Category="third" Value="30"/>
			<telerikCharting:CategoricalDataPoint Category="fourth" Value="15"/>
		</telerikChart:PointSeries>
	</telerikChart:RadCartesianChart>
</Grid>
Figure 1: RadCartesianChart with PointSeries