New to Telerik UI for WinUI? Start a free 30-day trial
Line Series
Updated on Mar 26, 2026
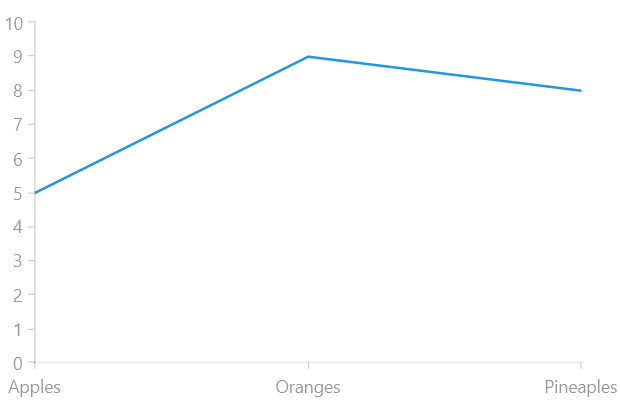
The LineSeries are represented on the chart as data points connected with straight line segments as shown on the image below.
LineSeries class inherits from the CategoricalStrokedSeries class -
Example
Examples 1, 2 and 3 show how to create a RadCartesianChart with a LineSeries.
Example 1: Defining the model
C#
public class Data
{
	public string Category { get; set; }

	public double Value { get; set; }
}
Example 2: Populating with data
C#
List<Data> data = new List<Data>();
data.Add(new Data() { Category = "Apples", Value = 5 });
data.Add(new Data() { Category = "Oranges", Value = 9 });
data.Add(new Data() { Category = "Pineaples", Value = 8 });

this.lineSeries.DataContext = data;
Example 3: Defining the LineSeries
XAML
<Grid xmlns:telerikChart="using:Telerik.UI.Xaml.Controls.Chart">
	<telerikChart:RadCartesianChart x:Name="lineSeries" PaletteName="DefaultLight">
		<telerikChart:RadCartesianChart.VerticalAxis>
			<telerikChart:LinearAxis/>
		</telerikChart:RadCartesianChart.VerticalAxis>
		<telerikChart:RadCartesianChart.HorizontalAxis>
			<telerikChart:CategoricalAxis/>
		</telerikChart:RadCartesianChart.HorizontalAxis>

		<telerikChart:LineSeries ItemsSource="{Binding}">
			<telerikChart:LineSeries.CategoryBinding>
				<telerikChart:PropertyNameDataPointBinding PropertyName="Category"/>
			</telerikChart:LineSeries.CategoryBinding>
			<telerikChart:LineSeries.ValueBinding>
				<telerikChart:PropertyNameDataPointBinding PropertyName="Value"/>
			</telerikChart:LineSeries.ValueBinding>
		</telerikChart:LineSeries>
	</telerikChart:RadCartesianChart>
</Grid>
Figure 1: Result from Example 3