New to Telerik UI for WinUI? Start a free 30-day trial
Bar Series
Updated on Mar 26, 2026
Data points are represented by a box where the height (width) of the box is the distance between the point’s numerical value and the categorical axis that plots the point. Bars may be either horizontal or vertical depending on whether the categorical axis is specified as an X-axis or as an Y-axis.
Properties
BarSeries class inherits from the CategoricalSeries class -
- PaletteMode: Gets or sets whether the chart palette will be applied on a per series or per datapoint basis. The available values are:
- Series: Applies the palette on a per series basis.
- DataPoint: Applies the palette on a per point basis.
Example
Examples 1, 2 and 3 show how to create a RadCartesianChart with a BarSeries.
Example 1: Defining the model
C#
public class Data
{
	public string Category { get; set; }

	public double Value { get; set; }
}
Example 2: Populating with data
C#
List<Data> data = new List<Data>();
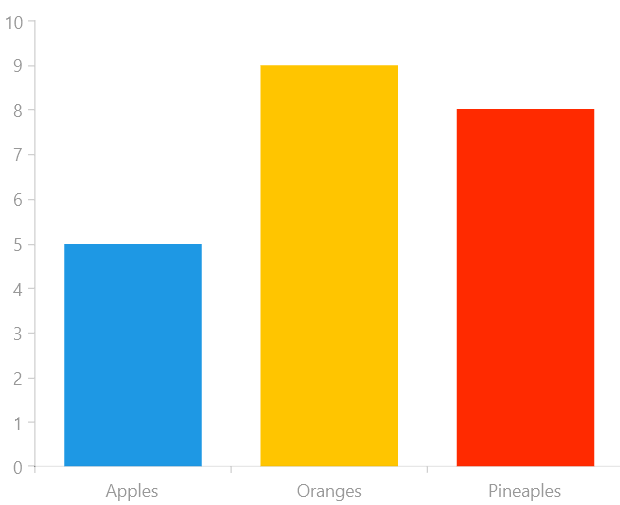
data.Add(new Data() { Category = "Apples", Value = 5 });
data.Add(new Data() { Category = "Oranges", Value = 9 });
data.Add(new Data() { Category = "Pineaples", Value = 8 });
this.barSeries.DataContext = data;Example 3: Defining the BarSeries
XAML
<Grid xmlns:telerikChart="using:Telerik.UI.Xaml.Controls.Chart">
	<telerikChart:RadCartesianChart x:Name="barSeries" PaletteName="DefaultLight">
		<telerikChart:RadCartesianChart.VerticalAxis>
			<telerikChart:LinearAxis/>
		</telerikChart:RadCartesianChart.VerticalAxis>
		<telerikChart:RadCartesianChart.HorizontalAxis>
			<telerikChart:CategoricalAxis/>
		</telerikChart:RadCartesianChart.HorizontalAxis>

		<telerikChart:BarSeries ItemsSource="{Binding}" PaletteMode="DataPoint">
			<telerikChart:BarSeries.CategoryBinding>
				<telerikChart:PropertyNameDataPointBinding PropertyName="Category"/>
			</telerikChart:BarSeries.CategoryBinding>
			<telerikChart:BarSeries.ValueBinding>
				<telerikChart:PropertyNameDataPointBinding PropertyName="Value"/>
			</telerikChart:BarSeries.ValueBinding>
		</telerikChart:BarSeries>
	</telerikChart:RadCartesianChart>
</Grid>
Figure 1: Result from Example 3