WPF PivotGrid Overview
Thank you for choosing RadPivotGrid!
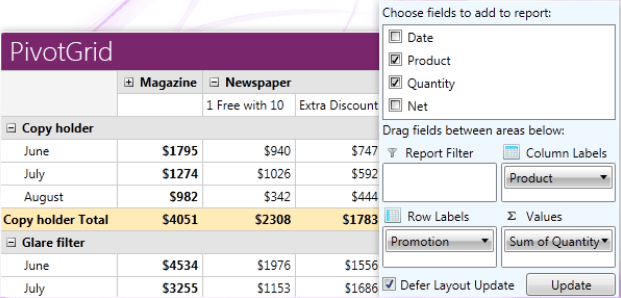
RadPivotGrid is a control used to aggregate millions of records in a concise tabular format. The data can be easily grouped, filtered, sorted and manipulated to create different reports.
As every control from UI for WPF, RadPivotGrid comes with a set of pre-defined themes. You can also design your own templates for a completely custom look.
Key Features
-
Filtering and Sorting
-
Multiple Data Sources Support:
-
Support for XMLA access to OLAP Cube.
-
Support for ADOMD access to OLAP Cube.
-
LocalDataSourceProvider with ItemsSource that implements IEnumerable interface.
-
QueryableDataProvider gives you the ability to execute all aggregations and calculations on the database server.
-
-
Built-in Aggregates: Sum, Min, Max, Average, Count, etc.
-
Grouping
-
Data Formatting: Currency, numbers after the decimal point, etc.
-
Parallel Asynchronous Data Processing
-
Different Pivot UI Layouts: Compact, Outline, Tabular.
-
Built-in Runtime Configuration Control: RadPivotFieldList.
-
Export to Different Formats: xlsx, docx, pdf, HTML.
-
DataProvider Serialization: Save the current state and load it later.
Get started with the control with its Getting Started help article that shows how to use it in a basic scenario.
Check out the online examples at demos.telerik.com
Telerik UI for WPF Support and Learning Resources
- Telerik UI for WPF PivotGrid Homepage
- Get Started with the Telerik UI for WPF PivotGrid
- Telerik UI for WPF API Reference
- Getting Started with Telerik UI for WPF Components
- Telerik UI for WPF Virtual Classroom (Training Courses for Registered Users)
- Telerik UI for WPF PivotGrid Forums
- Telerik UI for WPF Knowledge Base