New to Telerik UI for WPF? Start a free 30-day trial
OriginValue
Updated on Sep 15, 2025
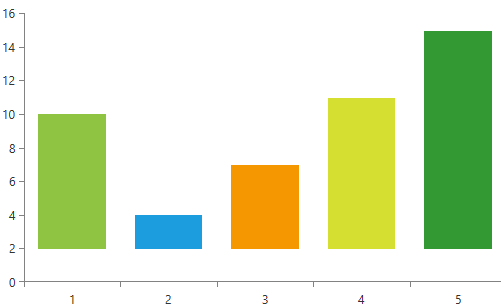
Some series in the RadChartView suite have a mechanism which allows for determining from where the data points start drawing. This can be utilized by setting the OriginValue property of the series. Example 1 demonstrates this property.
The series which support this property are: AreaSeries, ScatterAreaSeries, ScatterSplineAreaSeries, SplineAreaSeries, StepAreaSeries and BarSeries.
Example 1: BarSeries with OriginValue
XAML
		<telerik:RadCartesianChart Palette="Windows8">
			<telerik:RadCartesianChart.HorizontalAxis>
				<telerik:CategoricalAxis/>
			</telerik:RadCartesianChart.HorizontalAxis>

			<telerik:RadCartesianChart.VerticalAxis>
				<telerik:LinearAxis/>
			</telerik:RadCartesianChart.VerticalAxis>

			<telerik:RadCartesianChart.Series>
                <telerik:BarSeries OriginValue="2" PaletteMode="DataPoint">
                    <telerik:BarSeries.DataPoints>
						<telerik:CategoricalDataPoint Category="1" Value="10"/>
						<telerik:CategoricalDataPoint Category="2" Value="4"/>
						<telerik:CategoricalDataPoint Category="3" Value="7"/>
						<telerik:CategoricalDataPoint Category="4" Value="11"/>
						<telerik:CategoricalDataPoint Category="5" Value="15"/>
					</telerik:BarSeries.DataPoints>
				</telerik:BarSeries>
			</telerik:RadCartesianChart.Series>
		</telerik:RadCartesianChart>
Figure 1: Result from Example 1
For a demonstration in a different scenario, you can check out the OriginValue RadChartView SDK example.