New to Telerik UI for WPF? Start a free 30-day trial
Control the Series Items overlapping via ZIndex property
Updated on Sep 24, 2025
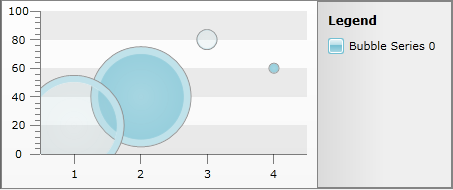
The following article demonstrates how to control the overlapping of Bubbles when they are positioned too close. By selecting one of the Bubbles the Canvas.ZIndex attached property will increase it's value (by default it is 0) which will cause the selected Bubble to be positioned over the others.
1. Create a class of Business Objects that will be used to populate the Chart:
C#
	public class UserDataPoint
	    {
	        private double _y;
	        private double _bubbleSize;
	        private string _legendLabel;

	        public UserDataPoint()
	        {
	        }

	        public UserDataPoint(double x, double y)
	        {
	            this._y = y;
	        }

	        public double Y
	        {
	            get
	            {
	                return _y;
	            }
	            set
	            {
	                this._y = value;
	            }
	        }

	        public double BubbleSize
	        {
	            get
	            {
	                return _bubbleSize;
	            }
	            set
	            {
	                this._bubbleSize = value;
	            }
	        }

	        public string LegendLabel
	        {
	            get
	            {
	                return _legendLabel;
	            }
	            set
	            {
	                this._legendLabel = value;
	            }
	        }
	    }

	    public static class SeriesExtensions
	    {

	        public static List<UserDataPoint> GetUserBubbleData()
	        {
	            List<UserDataPoint> points = new List<UserDataPoint>();

	            points.Add(CreateBubbleUserDataPoint(20, -100));
	            points.Add(CreateBubbleUserDataPoint(40, 100));
	            points.Add(CreateBubbleUserDataPoint(80, -20));
	            points.Add(CreateBubbleUserDataPoint(60, 10));

	            return points;
	        }

	        private static UserDataPoint CreateBubbleUserDataPoint(double valueY, double bubbleSize)
	        {
	            UserDataPoint dataPnt = new UserDataPoint();
	            dataPnt.Y = valueY;
	            dataPnt.BubbleSize = bubbleSize;
	            return dataPnt;
	        }

}2. Create a BubbleViewModel class:
C#
	public class BubbleViewModel
	    {
	        private List<UserDataPoint> _bubbleData;

	        public List<UserDataPoint> BubbleData
	        {
	            get
	            {
	                if (this._bubbleData == null)
	                {
	                    this._bubbleData = SeriesExtensions.GetUserBubbleData();
	                }

	                return this._bubbleData;
	            }
	        }
}3. Add a new RadChart declaration and new SeriesMapping (the Chart is populated via Manual Series Mapping).
XAML
	<TelerikChart:RadChart x:Name="RadChart1" ItemsSource="{Binding BubbleData}">
		<TelerikChart:RadChart.SeriesMappings>
			<TelerikCharting:SeriesMapping LegendLabel="Bubble Series 0">
				<TelerikCharting:SeriesMapping.SeriesDefinition>
					<TelerikCharting:BubbleSeriesDefinition  ItemStyle="{StaticResource CustomBubble}" BubbleSizeRelative="False">
						<TelerikCharting:BubbleSeriesDefinition.InteractivitySettings>
							<TelerikCharting:InteractivitySettings HoverScope="Item" SelectionMode="Single" SelectionScope="Item" />
						</TelerikCharting:BubbleSeriesDefinition.InteractivitySettings>
					</TelerikCharting:BubbleSeriesDefinition>
				</TelerikCharting:SeriesMapping.SeriesDefinition>
				<TelerikCharting:SeriesMapping.ItemMappings>
					<TelerikCharting:ItemMapping FieldName="Y" DataPointMember="YValue" />
					<TelerikCharting:ItemMapping FieldName="BubbleSize" DataPointMember="BubbleSize" />
				</TelerikCharting:SeriesMapping.ItemMappings>
			</TelerikCharting:SeriesMapping>
		</TelerikChart:RadChart.SeriesMappings>
	</TelerikChart:RadChart>
Selection of Bubble Items is achieved via Interactivity Effects feature of the RadChart.
4. In the MainPage.xaml.cs subscribe to SelectionChanged event of the ChartArea and make sure there is only one Bubble Item Selected. Set the Canvas.ZIndex property of the selected Bubble to 2000 and make it 0 for all others:
C#
	public MainPage()
	        {
	            InitializeComponent();

	            this.RadChart1.DefaultView.ChartArea.SelectionChanged += new EventHandler<ChartSelectionChangedEventArgs>(ChartArea_SelectionChanged);
	        }

	        void ChartArea_SelectionChanged(object sender, ChartSelectionChangedEventArgs e)
	        {
	            if (e.AddedItems.Count == 1)
	                SelectItem(e.AddedItems[0]);
	        }

	        private void SelectItem(DataPoint point)
	        {
	            var bubbles = this.RadChart1.DefaultView.ChartArea.ChildrenOfType<Bubble>();

	            foreach (Bubble item in bubbles)
	                item.ClearValue(Canvas.ZIndexProperty);

	            Bubble selectedBubble = bubbles.SingleOrDefault(bubble => bubble.DataContext == point);

	            if (selectedBubble != null)
	                Canvas.SetZIndex(selectedBubble, 2000);
	        }
}5. The result: