Interactivity Effects
The purpose of this topic is to demonstrate the selection/hover interactivity effects supported by the RadChart control.
Thе hover and selection interactivity effects greatly enhance the data presentation and readability in various business analysis scenarios. The hover and selection interactivity is supported for all 2D series types (note that "selection" for pie and doughnut types is implemented in the form of exploding the respective item slices). The interactivity support is disabled by default and can be controlled through the Interactivity API under SeriesDefinition.InteractivitySettings complex property:
-
HoverScope - gets or sets a value indicating the scope of interactivity for hover effects.
-
SelectionScope - gets or sets a value indicating the scope of interactivity for selection effects.
-
SelectionMode - gets or sets a value indicating the selection mode used by the chart control (single item or multiple items).
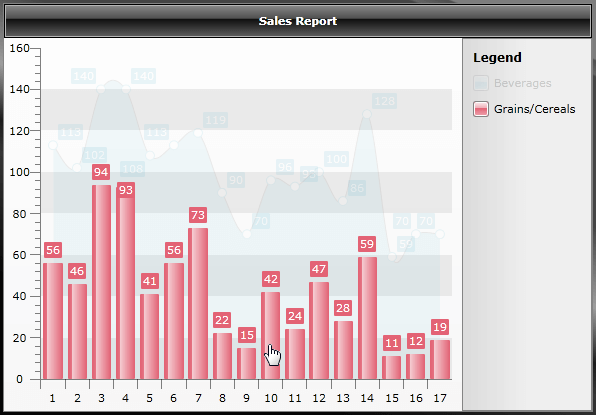
In the following example a new RadChart control is declared along with two series definitions - SplineAreaSeriesDefinition and BarSeriesDefintion.
	<telerik:RadChart x:Name="RadChart">
	    <telerik:RadChart.DefaultView>
	        <telerik:ChartDefaultView>
	            <telerik:ChartDefaultView.ChartTitle>
	                <telerik:ChartTitle Content="Sales Report" />
	            </telerik:ChartDefaultView.ChartTitle>
	        </telerik:ChartDefaultView>
	    </telerik:RadChart.DefaultView>
	    <telerik:RadChart.SeriesMappings>
	        <telerik:SeriesMapping LegendLabel="Beverages">
	            <telerik:SeriesMapping.SeriesDefinition>
	                <telerik:SplineAreaSeriesDefinition>
	                    <telerik:SplineAreaSeriesDefinition.InteractivitySettings>
	                        <telerik:InteractivitySettings HoverScope="Series" SelectionScope="Series" />
	                    </telerik:SplineAreaSeriesDefinition.InteractivitySettings>
	                </telerik:SplineAreaSeriesDefinition>
	            </telerik:SeriesMapping.SeriesDefinition>
	            <telerik:SeriesMapping.ItemMappings>
	                <telerik:ItemMapping DataPointMember="YValue" FieldName="Y4" />
	            </telerik:SeriesMapping.ItemMappings>
	        </telerik:SeriesMapping>
	        <telerik:SeriesMapping LegendLabel="Grains/Cereals">
	            <telerik:SeriesMapping.SeriesDefinition>
	                <telerik:BarSeriesDefinition>
	                    <telerik:BarSeriesDefinition.InteractivitySettings>
	                        <telerik:InteractivitySettings HoverScope="Series" SelectionScope="Series" />
	                    </telerik:BarSeriesDefinition.InteractivitySettings>
	                </telerik:BarSeriesDefinition>
	            </telerik:SeriesMapping.SeriesDefinition>
	            <telerik:SeriesMapping.ItemMappings>
	                <telerik:ItemMapping DataPointMember="YValue" FieldName="Y1" />
	            </telerik:SeriesMapping.ItemMappings>
	        </telerik:SeriesMapping>
	    </telerik:RadChart.SeriesMappings>
	</telerik:RadChart>
Take a look at the way the InteractivitySettings are declared for a specific definition:
	<telerik:BarSeriesDefinition>
	    <telerik:BarSeriesDefinition.InteractivitySettings>
	        <telerik:InteractivitySettings HoverScope="Series" SelectionScope="Series" />
	    </telerik:BarSeriesDefinition.InteractivitySettings>
	</telerik:BarSeriesDefinition>
For example if HoverScope is set to InteractivityScope.Series for a given bar series, when one hovers over a bar item, the whole series will be highlighted (i.e. all of the other series within the ChartArea will become temporarily transparent); otherwise if HoverScope is set to InteractivityScope.Item, when one hovers over a bar item, only the respective item will be highlighted (i.e. all of the other series as well all of the other bar items within the originating bar series will become temporarily transparent). The same principle applies for SelectionScope as well - if it is set to InteractivityScope.Series, all items within the series will be selected; alternatively if it set to InteractivtyScope.Item, only the respective item will be selected.
In order to enable the interactivity functionality you need to first set the interactivity scope for hover, selection, or both. The notion of "interactivity scope" specifies whether the chart control should interpret the interactivity action (selection or hover) on series level (if applicable), or on item level (if applicable).
InteractivityScope.Item is not supported for series that do not render separate items (Line, Spline, Area, Range, and all their stacked versions). InteractivityScope.Series is not supported for radial series (Pie and Doughnut).
There is one additional setting related to hover effects that can be set on global level - RadChart.HoverActivationDelay. This property gets or sets the delay before the hover effect is activated (by default there is no delay and the hover effect becomes active immediately).
You could check out an online example here.
Complete Demo Code
The following code snippets represent the complete source code used in the topic.
	<telerik:RadChart x:Name="RadChart">
	    <telerik:RadChart.DefaultView>
	        <telerik:ChartDefaultView>
	            <telerik:ChartDefaultView.ChartTitle>
	                <telerik:ChartTitle Content="Sales Report" />
	            </telerik:ChartDefaultView.ChartTitle>
	        </telerik:ChartDefaultView>
	    </telerik:RadChart.DefaultView>
	    <telerik:RadChart.SeriesMappings>
	        <telerik:SeriesMapping LegendLabel="Beverages">
	            <telerik:SeriesMapping.SeriesDefinition>
	                <telerik:SplineAreaSeriesDefinition>
	                    <telerik:SplineAreaSeriesDefinition.InteractivitySettings>
	                        <telerik:InteractivitySettings HoverScope="Series" SelectionScope="Series" />
	                    </telerik:SplineAreaSeriesDefinition.InteractivitySettings>
	                </telerik:SplineAreaSeriesDefinition>
	            </telerik:SeriesMapping.SeriesDefinition>
	            <telerik:SeriesMapping.ItemMappings>
	                <telerik:ItemMapping DataPointMember="YValue" FieldName="Y4" />
	            </telerik:SeriesMapping.ItemMappings>
	        </telerik:SeriesMapping>
	        <telerik:SeriesMapping LegendLabel="Grains/Cereals">
	            <telerik:SeriesMapping.SeriesDefinition>
	                <telerik:BarSeriesDefinition>
	                    <telerik:BarSeriesDefinition.InteractivitySettings>
	                        <telerik:InteractivitySettings HoverScope="Series" SelectionScope="Series" />
	                    </telerik:BarSeriesDefinition.InteractivitySettings>
	                </telerik:BarSeriesDefinition>
	            </telerik:SeriesMapping.SeriesDefinition>
	            <telerik:SeriesMapping.ItemMappings>
	                <telerik:ItemMapping DataPointMember="YValue" FieldName="Y1" />
	            </telerik:SeriesMapping.ItemMappings>
	        </telerik:SeriesMapping>
	    </telerik:RadChart.SeriesMappings>
</telerik:RadChart> public class DataObject
{
private static Random rand = new Random(Environment.TickCount);
private static Random adjrand = new Random(Environment.TickCount + rand.Next());
private double _y1;
private double _y2;
private double _y3;
private double _y4;
private double _y5;
public double Y1
{
get
{
return _y1;
}
set
{
_y1 = value;
}
}
public double Y2
{
get
{
return _y2;
}
set
{
_y2 = value;
}
}
public double Y3
{
get
{
return _y3;
}
set
{
_y3 = value;
}
}
public double Y4
{
get
{
return _y4;
}
set
{
_y4 = value;
}
}
public double Y5
{
get
{
return _y5;
}
set
{
_y5 = value;
}
}
public DataObject(double y1, double y2, double y3, double y4, double y5)
{
this.Y1 = y1;
this.Y2 = y2;
this.Y3 = y3;
this.Y4 = y4;
this.Y5 = y5;
}
public static List<DataObject> GetData()
{
List<DataObject> list = new List<DataObject>();
for (int i = 0; i < 17; i++)
{
double y1 = rand.Next(10, 100);
list.Add(new DataObject(y1, y1 + adjrand.Next(-10, 10), y1 + adjrand.Next(-5, 5), y1 + adjrand.Next(40, 75), y1 + adjrand.Next(20, 50)));
}
return list;
}
} this.RadChart.ItemsSource = DataObject.GetData();