New to Telerik UI for WinForms? Start a free 30-day trial
Negative Area Chart
Updated over 1 year ago
Environment
| Product Version | 2018.1 220 |
| Product | RadChartView for WinForms |
Description
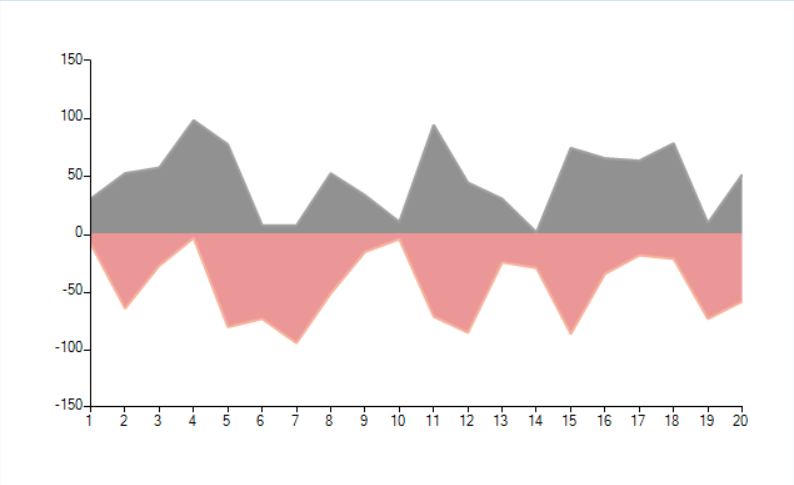
By default the area series are painted from bottom to top (above the horizontal axis). This article shows how you can paint a chart where the area is started from zero. This means that the positive values will go up and the negative down.
Figure 1: Sample Chart
Solution
The solution is to create a custom renderer, and custom draw part which allows you to override the entire painting code. You will use most of the default logic. What you need to change is the Y position of the are rectangle to be on the zero value.
The CustomAreaSeriesDrawPart
C#
class CustomAreaSeriesDrawPart : AreaSeriesDrawPart
{
    public CustomAreaSeriesDrawPart(AreaSeries series, ChartRenderer renderer) : base(series, renderer)
    { }
    public double GetLocationOfValue(object value, NumericalAxis axis)
    {
        NumericalAxisModel model = axis.Model as NumericalAxisModel;
        double val = Convert.ToDouble(value);
        val = (double)model.TransformValue(val);
        double delta = axis.ActualRange.Maximum - axis.ActualRange.Minimum;
        double normalizedValue = (val - axis.ActualRange.Minimum) / delta;
        IChartView view = (IChartView)axis.View;
        CartesianArea area = axis.View.GetArea<CartesianArea>();
        double result;
        if (area != null &&
            ((area.Orientation == Orientation.Vertical && axis.AxisType == Telerik.Charting.AxisType.First) ||
            (area.Orientation == Orientation.Horizontal && axis.AxisType == Telerik.Charting.AxisType.Second)))
        {
            result = view.PlotOriginX + axis.Model.LayoutSlot.X + normalizedValue * (axis.Model.LayoutSlot.Width * view.ZoomWidth);
        }
        else
        {
            result = view.PlotOriginY + ((Telerik.WinControls.UI.ChartView)view).Margin.Top + axis.Model.LayoutSlot.Y + (1.0d - normalizedValue) * (axis.Model.LayoutSlot.Height * view.ZoomHeight);
        }
        return result;
    }
    protected override void DrawArea()
    {
        CartesianRenderer renderer = (CartesianRenderer)this.Renderer;
        AreaSeries area = this.Element as AreaSeries;
        Graphics graphics = renderer.Graphics;
        RadGdiGraphics radGraphics = new RadGdiGraphics(graphics);
        RectangleF rect = ChartRenderer.ToRectangleF(this.Element.Model.LayoutSlot);
        RectangleF clipRect = (RectangleF)renderer.Area
            .GetType()
            .GetMethod("GetCartesianClipRect", BindingFlags.Instance | BindingFlags.NonPublic)
            .Invoke(renderer.Area, new object[] { });
        PointF topLeft = new PointF(clipRect.X, clipRect.Y);
        PointF topRight = new PointF(clipRect.Right - 1, clipRect.Y);
        PointF lowerRight = new PointF(clipRect.Right - 1, clipRect.Bottom - 1);
        PointF lowerLeft = new PointF(clipRect.X, clipRect.Bottom - 1);
        List<PointF[]> allPoints = GetPointsPositionsArrays();
        float zeroOnTheYAxis = (float)this.GetLocationOfValue(0, (NumericalAxis)area.VerticalAxis);
        lowerLeft.Y = zeroOnTheYAxis;
        lowerRight.Y = zeroOnTheYAxis;
        foreach (PointF[] points in allPoints)
        {
            if (points.Length < 2)
            {
                continue;
            }
            GraphicsPath fillPath = this.GetLinePaths(points);
            if (fillPath == null)
            {
                continue;
            }
            if (this.Element.View.GetArea<CartesianArea>().Orientation == System.Windows.Forms.Orientation.Vertical)
            {
                if (area.VerticalAxis.IsInverse)
                {
                    fillPath.AddLine(points[points.Length - 1], new PointF(points[points.Length - 1].X, topRight.Y));
                    fillPath.AddLine(topRight, topLeft);
                    fillPath.AddLine(new PointF(points[0].X, topLeft.Y), points[0]);
                }
                else
                {
                    fillPath.AddLine(points[points.Length - 1], new PointF(points[points.Length - 1].X, lowerRight.Y));
                    fillPath.AddLine(lowerRight, lowerLeft);
                    fillPath.AddLine(new PointF(points[0].X, lowerLeft.Y), points[0]);
                }
            }
            else
            {
                if (area.HorizontalAxis.IsInverse)
                {
                    fillPath.AddLine(points[points.Length - 1], topRight);
                    fillPath.AddLine(topRight, lowerRight);
                    fillPath.AddLine(lowerRight, points[0]);
                }
                else
                {
                    fillPath.AddLine(points[points.Length - 1], topLeft);
                    fillPath.AddLine(topLeft, lowerLeft);
                    fillPath.AddLine(lowerLeft, points[0]);
                }
            }
            FillPrimitiveImpl fill = new FillPrimitiveImpl(this.Element, null);
            fill.PaintFill(radGraphics, fillPath, clipRect);
            GraphicsPath borderPath = new GraphicsPath();
            AreaSeries series = (AreaSeries)this.Element;
            borderPath = new GraphicsPath();
            if (series.StrokeMode == AreaSeriesStrokeMode.All ||
                series.StrokeMode == AreaSeriesStrokeMode.AllButPlotLine ||
                series.StrokeMode == AreaSeriesStrokeMode.LeftAndPoints ||
                series.StrokeMode == AreaSeriesStrokeMode.LeftLine)
            {
                if (this.Element.View.GetArea<CartesianArea>().Orientation == System.Windows.Forms.Orientation.Vertical)
                {
                    if (area.VerticalAxis.IsInverse)
                    {
                        borderPath.AddLine(topLeft, points[0]);
                    }
                    else
                    {
                        borderPath.AddLine(lowerLeft, points[0]);
                    }
                }
                else
                {
                    if (area.HorizontalAxis.IsInverse)
                    {
                        borderPath.AddLine(lowerRight, points[0]);
                    }
                    else
                    {
                        borderPath.AddLine(lowerLeft, points[0]);
                    }
                }
            }
            if (series.StrokeMode == AreaSeriesStrokeMode.All ||
                series.StrokeMode == AreaSeriesStrokeMode.AllButPlotLine ||
                series.StrokeMode == AreaSeriesStrokeMode.LeftAndPoints ||
                series.StrokeMode == AreaSeriesStrokeMode.Points ||
                series.StrokeMode == AreaSeriesStrokeMode.RightAndPoints)
            {
                GraphicsPath path = GetLinePaths(points);
                if (path != null)
                {
                    borderPath.AddPath(path, true);
                }
            }
            if (series.StrokeMode == AreaSeriesStrokeMode.All ||
                series.StrokeMode == AreaSeriesStrokeMode.AllButPlotLine ||
                series.StrokeMode == AreaSeriesStrokeMode.RightAndPoints ||
                series.StrokeMode == AreaSeriesStrokeMode.RightLine)
            {
                if (this.Element.View.GetArea<CartesianArea>().Orientation == System.Windows.Forms.Orientation.Vertical)
                {
                    if (area.VerticalAxis.IsInverse)
                    {
                        borderPath.AddLine(points[points.Length - 1], topRight);
                    }
                    else
                    {
                        borderPath.AddLine(points[points.Length - 1], lowerRight);
                    }
                }
                else
                {
                    if (area.HorizontalAxis.IsInverse)
                    {
                        borderPath.AddLine(points[points.Length - 1], topRight);
                    }
                    else
                    {
                        borderPath.AddLine(points[points.Length - 1], topLeft);
                    }
                }
            }
            if (series.StrokeMode == AreaSeriesStrokeMode.All ||
                series.StrokeMode == AreaSeriesStrokeMode.PlotLine)
            {
                if (this.Element.View.GetArea<CartesianArea>().Orientation == System.Windows.Forms.Orientation.Vertical)
                {
                    if (area.VerticalAxis.IsInverse)
                    {
                        borderPath.AddLine(topRight, topLeft);
                    }
                    else
                    {
                        borderPath.AddLine(lowerRight, lowerLeft);
                    }
                }
                else
                {
                    if (area.HorizontalAxis.IsInverse)
                    {
                        borderPath.AddLine(topRight, lowerRight);
                    }
                    else
                    {
                        borderPath.AddLine(lowerLeft, topLeft);
                    }
                }
            }
            BorderPrimitiveImpl border = new BorderPrimitiveImpl(this.Element, null);
            border.PaintBorder(radGraphics, null, borderPath, rect);
            if (series.Image != null)
            {
                graphics.SetClip(fillPath);
                ImagePrimitiveImpl image = new ImagePrimitiveImpl(series);
                image.PaintImage(radGraphics, series.Image, clipRect, series.ImageLayout, series.ImageAlignment, series.ImageOpacity, false);
                graphics.ResetClip();
            }
        }
    }
}
Now you are need to change the default draw part within the custom renderer class.
The Custom Renderer
C#
public class CustomCartesianRenderer : CartesianRenderer
{
    public CustomCartesianRenderer(CartesianArea area)
        : base(area)
    { }
    protected override void Initialize()
    {
        base.Initialize();
        for (int i = 0; i < this.DrawParts.Count; i++)
        {
            AreaSeriesDrawPart linePart = this.DrawParts[i] as AreaSeriesDrawPart;
            if (linePart != null)
            {
                this.DrawParts[i] = new CustomAreaSeriesDrawPart((AreaSeries)linePart.Element, this);
            }
        }
    }
}
The final step is to setup the chart and change the defualt renderer.
Setup the ChartView
C#
public NegativeAreaChart()
{
    InitializeComponent();
    radChartView1.CreateRenderer += RadChartView1_CreateRenderer;
    AreaSeries areaSeries = new AreaSeries();
    // areaSeries.Spline = true;
    AreaSeries areaSeries2 = new AreaSeries();
    for (int x = 0; x < 60; x++)
    {
        areaSeries.DataPoints.Add(rnd.Next(1, 100), x);
        areaSeries2.DataPoints.Add(rnd.Next(1, 100) * -1, x);
    }
    this.radChartView1.Series.Add(areaSeries);
    this.radChartView1.Series.Add(areaSeries2);
}
private void RadChartView1_CreateRenderer(object sender, ChartViewCreateRendererEventArgs e)
{
    e.Renderer = new CustomCartesianRenderer(e.Area as CartesianArea);
}
A complete solution is available in our SDK repository.