or
2 answers
498 views
I have a RadDock with several MdiChildren/DockWindows. When the user closes one of the tabs I want the focus to be set to the previously active tab.
In the ActiveWindowChanged event I remeber the previous active tab.
I've tried both the radDock.ActivateMdiChild(Form) and radDock.ActivateWindow(DockWindow) methods
What am I missing?
bool exists = (Array.IndexOf(radDock.MdiChildren, _currentMdi) != -1); if (!exists && _prevMdi != null) { _currentMdi = null; _currentDockWindow = null; //radDock.ActivateMdiChild(_prevMdi); radDock.ActivateWindow(_prevDockWindow); } _prevMdi = _currentMdi; _currentMdi = (Form) ((HostWindow) e.DockWindow).Content;_prevDockWindow = _currentDockWindow;
_currentDockWindow = e.DockWindow;

Dinko | Tech Support Engineer
Telerik team

answered
on
20 Dec 2023
2 answers
165 views
Hello,
I am using RadScheduler with a grouped TimelineView. The number of resources can be selected with a TrackBar, but if the selected value is to high, the view looks squezed and I got overlappings in my customized resource header elements. So my Idea is a minimum ResourceHeaderHeigth. I want to achieve this by calculating the maximum suitable ResourcesPerView value when the Trackbar is changed or the Form / Scheduler is resized. E.g. if my Scheduler has 250 px size, max 5 resources should be visible and if the size is resized to 200 px, only 4 should be shown, so that every resource has at least 50px height.
But to achieve this I need to get the size of the area, where the resources are paintet or SchedulerSize minus Header and Footer.
        private void tbVisibleResourceCount_ValueChanged(object sender, EventArgs e)
        {
            if (DesignMode)
                return;

            try
            {
                int val = (int) tbVisibleResourceCount.Value;

                if (val <= 0)
                {
                    tbVisibleResourceCount.Value = 1;
                }
                else
                {
                    var newValue = Math.Min(val, AppointmentsVm?.AktiveRessourcen?.Count ?? 0 /*rsTermine.Resources.Count*/);

                    /* todo
                    switch (rsTermine.SchedulerElement.ViewElement)
                    {
                        case SchedulerTimelineViewElement timelineElement:
                            break;

                        case SchedulerDayViewElement dayViewElement:
                            break;

                        case SchedulerMonthViewElement monthViewElement:
                            break;

                        case TimelineGroupingByResourcesElement timelineGrouped:
                            IList<SchedulerTimelineViewElement> childTimelineElements = timelineGrouped.GetChildViewElements();
                            break;

                        case SchedulerDayViewGroupedByResourceElement dayViewGrouped:
                            break;

                        case SchedulerMonthViewGroupedByResourceElement monthViewGrouped:
                            break;
                    }*/

                    rsTermine.ActiveView.ResourcesPerView = newValue;
                }

                SetAppointmentsMargin();
                _adjustBackgroundsTimer?.Reset();
            }
            catch (Exception ex)
            {
                LogHelper.HandleError<CalendarView>(this, $"Fehler in {nameof(tbVisibleResourceCount_ValueChanged)}", ex);
            }
        }
Hope you can help me with this problem.
Regards,
Stephan

Stephan
Top achievements
 Rank 3
 Bronze
 Iron
Iron
 Iron
Iron
Iron
Iron
answered
on
19 Dec 2023
1 answer
164 views
I'm trying RadVirtualGrid with Hierarchy but when columns are resized, and needs to show scrollbar, height of child table element is not updated.
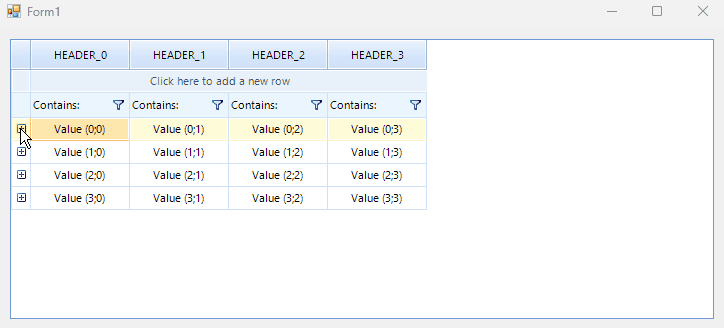
Is this a bug? Can I update it manualy?
Other issue I have noticed is: when child column header is wider than parent row, it is not longer resizable:
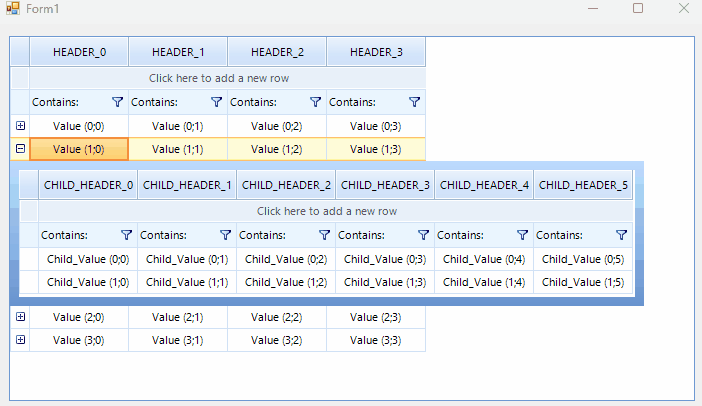
This is the code used in this examples:
public partial class Form1 : Form
    {

        private int parentRows = 4;
        private int parentColumns = 4;

        private int childRows = 2;
        private int childColumns = 6;

        public Form1()
        {
            InitializeComponent();

            this.grid.CellValueNeeded += (s, e) =>
            {
                if (e.ViewInfo == this.grid.MasterViewInfo)
                {
                    if (e.ColumnIndex < 0) return;
                    else if (e.RowIndex == RadVirtualGrid.HeaderRowIndex)
                    {
                        e.Value = "HEADER_" + e.ColumnIndex;
                    }

                    else if (e.RowIndex < 0)
                    {
                        e.Value = "FIELD_" + e.ColumnIndex;
                    }

                    else if (e.RowIndex >= 0 && e.RowIndex < parentRows)
                    {
                        e.Value = "Value (" + e.RowIndex + ";" + e.ColumnIndex + ")";
                    }
                }
                else
                {

                    if (e.ColumnIndex < 0) return;
                    else if (e.RowIndex == RadVirtualGrid.HeaderRowIndex)
                    {
                        e.Value = "CHILD_HEADER_" + e.ColumnIndex;
                    }

                    else if (e.RowIndex < 0)
                    {
                        e.Value = "CHILD_FILED_ " + e.ColumnIndex;
                    }

                    else if (e.RowIndex >= 0 && e.RowIndex < childRows)
                    {
                        e.Value = "Child_Value (" + e.RowIndex + ";" + e.ColumnIndex + ")";
                    }

                }
            };

            this.grid.QueryHasChildRows += (s, e) =>
            {
                e.HasChildRows = e.ViewInfo == this.grid.MasterViewInfo && e.RowIndex >= 0 && e.RowIndex < parentRows;
            };

            this.grid.RowExpanding += (s, e) =>
            {
                e.ChildViewInfo.ColumnCount = childColumns;
                e.ChildViewInfo.RowCount = childRows;
            };


            this.grid.RowCount = parentRows;
            this.grid.ColumnCount = parentColumns;
        }
    }
Dinko | Tech Support Engineer
Telerik team
answered
on
19 Dec 2023
1 answer
129 views
I can't consistently have the SelectedItemChanged event called when clicking an item with a Listview in IconsView. If a click is made in empty space, the event is triggered.
What am I missing?
Attached is a sample app.
Thanks,
_D

Nadya | Tech Support Engineer
Telerik team
answered
on
18 Dec 2023
2 answers
217 views
Hi team,
I have a scenario where we need to add line series to the chart dynamically from code behind and I need to bind live data (i.e, data changes for every 2 seconds) . I am using Telerik UI for WinForms controls .
One static line series work perfectly fine using the demo sample. The problem is adding 'n' number of line series and setting data every 2 seconds . In the sample , data is set using a global variable. but we need to achieve the same dynamically
Can anyone guide on this
1 answer
130 views
Mouse Down event invalid.
private void radTextBox1_MouseDown(object sender, MouseEventArgs e){
radTextBox1.Text = "test";
}
1 answer
206 views
I have a radgridview grid with paging. I have a mouse double click event:
private void RgvSyncUp_MouseDoubleClick(object? sender, MouseEventArgs e)
{
	var rgv = (RadGridView)sender;
	var myRow = rgv.CurrentRow;
	var dlg = new DlgPendingSync(myRow);
	dlg.ShowDialog();
}
The problem I am having is this, that if the user double clicks a paging control it fires off the mouse double click event and the dialog mentioned in the code gets shown.
Is there a way to trap or prevent this or prevent the double click on the paging control from firing off my dialog?
Thank you,
Kevin
Dinko | Tech Support Engineer
Telerik team
answered
on
07 Dec 2023
1 answer
184 views
BestFitColumns is a great way to stretch/narrow your columns based on the data they contain.
There are a few issues when using this. My suggestion deals with one of them.
Suggestion: When using BestFitColumns, please add a new optional Parameter called "PadWidth" or something similar. This would be an Integer value and when the BestFitColumns executes, it will add "PadWidth" pixels to the width of the column AFTER calculating the 'Best Fit' width.
Reason: Several Themes will accurately "squeeze" column width's so they JUST BARELY fit the Column Data. While this may be the desired output, it's rather unpleasant to look at: The data is smashed right up against both left and right cell borders. Additionally, some themes have a 2 or more pixel, Cell FOCUSED border (I don't know what to call it. The 'cursor' perhaps? The visual indicator of what Cell the user is currently on.
Anyway, as you move this 'Cursor' if you navigate to a cell where the data was the widest, this thicket "border" takes up too much room in the cell to display the entire string, and so you're back to seeing Ellipses instead of the entire data.
By adding an Optional "PadWidth" value (I'll use 10 for example) AFTER the BestFit width has been calculated but before that is applied to all columns, the cell width will gain an additional 10 pixels. This will allow for the extra-wide Cell "cursors" as well as allow developers to create less "cramped" grids.
Dinko | Tech Support Engineer
Telerik team
answered
on
06 Dec 2023
1 answer
276 views
Hi!
I have a chart with multiple Y axes, series, and an X axis as DateTimeContinuousAxis.
The thing is my chart is customizable and I should be able to change the series styling from line to column. When I change one of my series to a column, it is not centered with the rest of the series and according to the X-axis (see first img).
See the tooltips that the lines are at the same point (img2) but when I change to column, the column ends at that point, it is not centered.
Any suggestion?
Columns
Linear
Dinko | Tech Support Engineer
Telerik team
answered
on
05 Dec 2023
1 answer
170 views
Hi,
I add shape page. In shape of text can I do change color of text at third line similar like picture? If I choose third line of text change color can first and second text no change color? How I write it. Because user want to change or add any of text color.
Thanks.
Dinko | Tech Support Engineer
Telerik team
answered
on
04 Dec 2023


