The Demo site shows a Stacked Bar Chart and states "This is accomplished by setting the GroupName property of each StackedBarSeriesDefinition". A reply to another thread repeats this assertion. But there is no such "GroupName" property on this StackedBarSeriesDefinition class and attempting to use one in XAML causes a XAMLParse exception.
The "code behind" for the demo, which might give some clues, doesn't help because everything is locked away in a "sample" dll.
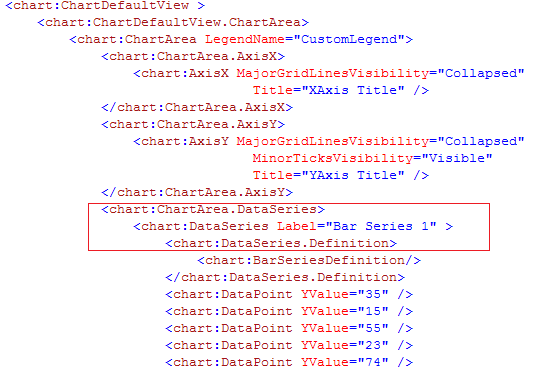
I was going to ask if someone could provide a XAML snippet showing how a StackedBarChart like that shown in the demo can be accomplished but after a LOT of trial and error I managed to create one using the XAML shown at the bottom of this post. Notice the complete absence of anything to do with "GroupName"! Hopefully it might help someone else struggling with this stuff, the way I have been over the last few days!
At the moment, I'm using the "Creating Chart Declaratively" page of the documentation to try and work out how to use the charting functionality, but it's very thin on explanation or any kind of proper charting overview. The simple code given on that page builds but causes errors (red squiggly lines) to be shown for the ChartArea.DataSeries element ("Writable property or collection expected") and for the DataSeries declaration that immediately follows it ("Invalid type"). Is there any way to remove these as they get in the way of understanding where any REAL errors in the XAML might be or should this just be considered "business as usual" for Telerik controls (I've got used to endless exceptions in the Design View but had hoped the XAML view would be clean).
Telerik, you seem to have some nice controls that can be coerced into delivering what customers want but if you want trial versions to turn into sales you really need to sort something out with regard to documentation and the specific detail of the answers given here (I'm still scratching my head on the "theme selection" snippet - I have 3 different 'theme' dlls I'm supposed to add but somehow they all magically resolve to the same "telerik" namespace prefix used in XAML?!).
Developers purchase controls to increase productivity but the ramp-up time on Telerik controls because of poor documentation/misinformation given is huge. The demo's purport to show code but invariably the most interesting ones just show a few lines, with most of the required information hidden away in dlls. Comments like "use the GroupName property" or "set SmallIncrement" don't help at all when these properties don't exist and just lead to wasted time and frustration, where a simple line or two of code snippet would have solved the problem. MS advice continually recommends putting all the UI into declarative XAML so demo's/training information that hides everything away in dlls really isn't very helpful!
<tkc:ChartDefaultView.ChartArea>
<tkc:ChartArea LegendName="Stack1">
<tkc:ChartArea.DataSeries>
<tkc:DataSeries Label="Pension Fund">
<tkc:DataSeries.Definition>
<tkc:StackedBarSeriesDefinition />
</tkc:DataSeries.Definition>
<tkc:DataPoint YValue="3000" />
<tkc:DataPoint YValue="8000" />
<tkc:DataPoint YValue="11000" />
</tkc:DataSeries>
<tkc:DataSeries Label="Stack2">
<tkc:DataSeries.Definition>
<tkc:StackedBarSeriesDefinition />
</tkc:DataSeries.Definition>
<tkc:DataPoint YValue="4000" />
<tkc:DataPoint YValue="6000" />
<tkc:DataPoint YValue="8000" />
</tkc:DataSeries>
</tkc:ChartArea.DataSeries>
</tkc:ChartArea>
Thanks for reading.
The "code behind" for the demo, which might give some clues, doesn't help because everything is locked away in a "sample" dll.
I was going to ask if someone could provide a XAML snippet showing how a StackedBarChart like that shown in the demo can be accomplished but after a LOT of trial and error I managed to create one using the XAML shown at the bottom of this post. Notice the complete absence of anything to do with "GroupName"! Hopefully it might help someone else struggling with this stuff, the way I have been over the last few days!
At the moment, I'm using the "Creating Chart Declaratively" page of the documentation to try and work out how to use the charting functionality, but it's very thin on explanation or any kind of proper charting overview. The simple code given on that page builds but causes errors (red squiggly lines) to be shown for the ChartArea.DataSeries element ("Writable property or collection expected") and for the DataSeries declaration that immediately follows it ("Invalid type"). Is there any way to remove these as they get in the way of understanding where any REAL errors in the XAML might be or should this just be considered "business as usual" for Telerik controls (I've got used to endless exceptions in the Design View but had hoped the XAML view would be clean).
Telerik, you seem to have some nice controls that can be coerced into delivering what customers want but if you want trial versions to turn into sales you really need to sort something out with regard to documentation and the specific detail of the answers given here (I'm still scratching my head on the "theme selection" snippet - I have 3 different 'theme' dlls I'm supposed to add but somehow they all magically resolve to the same "telerik" namespace prefix used in XAML?!).
Developers purchase controls to increase productivity but the ramp-up time on Telerik controls because of poor documentation/misinformation given is huge. The demo's purport to show code but invariably the most interesting ones just show a few lines, with most of the required information hidden away in dlls. Comments like "use the GroupName property" or "set SmallIncrement" don't help at all when these properties don't exist and just lead to wasted time and frustration, where a simple line or two of code snippet would have solved the problem. MS advice continually recommends putting all the UI into declarative XAML so demo's/training information that hides everything away in dlls really isn't very helpful!
<tkc:ChartDefaultView.ChartArea>
<tkc:ChartArea LegendName="Stack1">
<tkc:ChartArea.DataSeries>
<tkc:DataSeries Label="Pension Fund">
<tkc:DataSeries.Definition>
<tkc:StackedBarSeriesDefinition />
</tkc:DataSeries.Definition>
<tkc:DataPoint YValue="3000" />
<tkc:DataPoint YValue="8000" />
<tkc:DataPoint YValue="11000" />
</tkc:DataSeries>
<tkc:DataSeries Label="Stack2">
<tkc:DataSeries.Definition>
<tkc:StackedBarSeriesDefinition />
</tkc:DataSeries.Definition>
<tkc:DataPoint YValue="4000" />
<tkc:DataPoint YValue="6000" />
<tkc:DataPoint YValue="8000" />
</tkc:DataSeries>
</tkc:ChartArea.DataSeries>
</tkc:ChartArea>
Thanks for reading.