or
0 answers
262 views
Hi all
I use a kendo grid to display some datas (with VUE JS 3 ) . This one is pageable.
I use the event "page" called when I change the page. I try to call initContextMenu from this event but I have the error "initContextMenu" is not a function"...
How can I call initContextMenu ? thanks you !
grid:function () {
kendo.jQuery("#grid").kendoGrid({
columns: [
{
field: "title",
title: "Titre",
template: "<div>#: title #</div>",
},
],
dataSource: this.dataS.orders,
pageable: {
pageSize: 11,
buttonCount: 7,
},
page: function (e) {
initContextMenu(); // I would like call this function
console.log(e.page);
},
});
},
initContextMenu:function () {
// then ....
},
0 answers
252 views
Hi everyone,
I've been banging my head with an issue with KendoUI grid (for JQuery) and I was hoping I could get some help.
I've implemented server side pagination and filtering in my project and I send all the filtering parameters to a stored procedure.
It works fine, both the filtering and the pagination. The problem is when the data is returned to the grid if I had made a date range filtering.
ONLY with date range filtering. If I search only by string columns, I have no issues. If I search by only a date (not a range), it works too.
My guess is that it doesn't like to have two filters with the same key.
Here's my filter function:
const DatagridFilter = (e) => {
    const grid = datagrid.getGrid();
    let CurrentFilters = grid.getOptions().dataSource.filter?.filters || [];

    let filters = [];

    if (e.filter == null) {
        angular.forEach(CurrentFilters, function (value, key) {
            if (value.filters.some(item => item.field !== e.field)) {
                filters.push(value);
            }
        });
    } else {
        let NewFilter = { logic: e.filter.logic, filters: [] };
        e.filter.filters.map(f => {
            NewFilter.filters.push({
                field: f.field,
                operator: f.operator,
                value: f.value
            });
        });

        let exist = false;
        angular.forEach(CurrentFilters, function (value, key) {
            if (value.filters.some(item => item.field === e.field)) {
                exist = true;
                filters.push(NewFilter);
            }
            else {
                filters.push(value);
            }
        });
        if (!exist) {
            filters.push(NewFilter);
        }
    }

    datagrid.setGridFilters(kendo.stringify(filters));
    if (filters.length > 0) {
        GridBind(1);
    } else {
        datagrid.resetGridFilters();
    }
}
And here's my DataGrid definition:
$("#grid").kendoGrid({
        excel: {
            allPages: true
        },
        filterable: {
            extra: false,
            operators: {
                string: {
                    contains: "Contains",
                    startswith: "Starts with",
                    endswith: "Ends With",
                    doesnotcontain: "Doesn't contain",
                    doesnotstartwith: "Does not start",
                    eq: "Is equal to",
                    neq: "Is not equal to",
                    isempty: "Empty",
                    isnotempty: "Not empty",
                },
                number: {
                    eq: "Equal to",
                    neq: "Not equal to",
                    lt: "less than",
                    lte: "less than or equal to",
                    gt: "greater than",
                    gte: "greater than or equal to",
                    startswith: "Starts With",
                    contains: "Contains",
                    doesnotcontain: "Doesn't contain",
                    doesnotstartwith: "Does not start",
                    endswith: "Ends With",
                    isnull: "Is Null",
                    isnotnull: "Is Not Null",
                },
                date: {
                    gte: "From Date",
                    lte: "To Date"
                }
            }
        },
        filter: (e) => DatagridFilter(e),
        sort: (e) => DatagridSort(e),
        page: (e) => GridBind(e.page),
        sortable: true,
        autoBind: false,
        navigatable: true,
        serverPaging: true,
        serverFiltering: true,
        serverSorting: true,
        height: gridAutoHeight,
        toolbar: [{ template: kendo.template($("#templ_toolbar").html()) }],
        columns: datagridColumns
    });
Any ideas of what could be happening?
Thanks!
3 answers
181 views
Hi, we were testing Telerik Server Grouping with virtualization, as it is shown in the example for it and we are seeing strange behaviour.
When I select a group which has enough records inside, the scrolling in the group down to make it request another page will actually append again the same records which are already displayed - from the first page actually.
The easiest steps to reproduce this behaviour is
1. Go to demo page
https://demos.telerik.com/kendo-ui/grid/server-grouppaging-virtualization and click to Edit in Dojo. It opens https://dojo.telerik.com/afoCefOJ
Then, to get rid of narrow groups I will change grouping from
group: [{
                        field: "city",
                        dir: "asc"
                    }, {
                        field: "companyName",
                        dir: "asc"
                    }],
to
group: [{
                        field: "city",
                        dir: "asc"
                    }],
and also adjust pageSize to 10:
pageSize: 10,
2. Now, when I Run example, open Chrome Debug tools to Network traffic and expand Shady shores, I get records starting with:
GC30TRSSMTI706Z, Ireland
I can see first request starting wtih Page:1
3. Now I scroll the virtual view just a bit down to get another 10 records. Surprisingly, I get same records again.
GC30TRSSMTI706Z, Ireland
Is it expected behaviour, or how can I fix it to scroll to next records on another request ?
Thank you kindly,
Martin

Neli
Telerik team

answered
on
05 Jul 2021
1 answer
3.7K+ views
The autoFitColum method sizes the chosen column to the correct size, but it also reduces all other columns to their width property as shown below.
I created some examples to show what I'm talking about by editing autoFitColumn - API Reference - Kendo UI Grid | Kendo UI for jQuery (telerik.com)
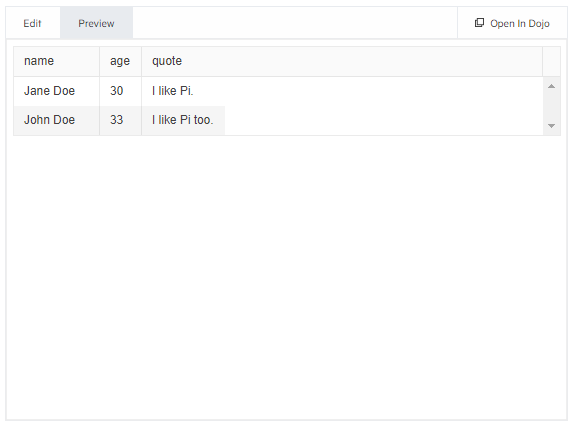
This behavior works out in cases where the auto fit column exceeds the grid width (see figure 1), but not in cases where the the data is Smaller than the grid (see figure 2).
The desired behavior, for me, would be for the autoFitColumn method to act like setting the width manually (see figure 3 or dojo example). I need scrollable to be true and grid width to be auto to work on any screen width. Allowing the rows to text-wrap doesn't work for scrolling large data tables.
Is figure 2 the intended behavior, and is there a way to achieve my desired behavior?
<div id="grid"></div><script>
$("#grid").kendoGrid({
columns: [
{ field: "name", width: 100 },
{ field: "age", width : 50 },
{ field: "quote" }
],
dataSource: [
{ name: "Jane Doe", age: 30, quote: "I like Pi." },
{ name: "John Doe", age: 33, quote: "The FitnessGram™ Pacer Test ... ding" }
],
scrollable: true,
width: 'auto'
});
var grid = $("#grid").data("kendoGrid");
grid.autoFitColumn("quote");
</script>
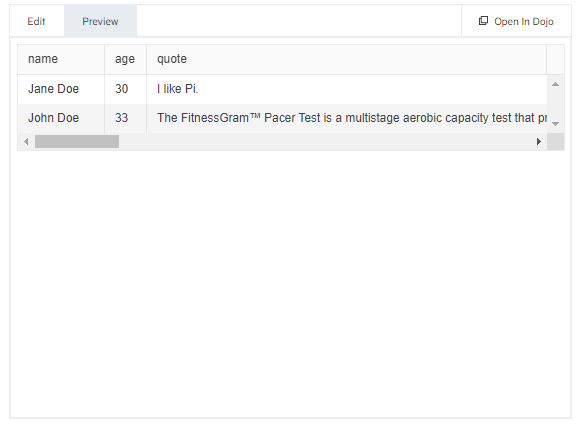
figure 1: behavior of autoFitColumn if data is longer than grid is wide.
<div id="grid"></div><script>
$("#grid").kendoGrid({
columns: [
{ field: "name", width: 100 },
{ field: "age", width : 50 },
{ field: "quote", }
],
dataSource: [
{ name: "Jane Doe", age: 30, quote: "I like Pi." },
{ name: "John Doe", age: 33, quote: "I like Pi too." }
],
scrollable: true,
width: 'auto'
});
var grid = $("#grid").data("kendoGrid");
grid.autoFitColumn("quote");
</script>
firuge 2: behavior of autoFitColumn if data is shorter than grid is wide
<div id="grid"></div><hr/><div id="grid2"></div><script>
$("#grid").kendoGrid({
columns: [
{ field: "name", width: 100 },
{ field: "age", width : 50 },
{ field: "quote", width : 3272 } //this width should be set by autoFitColumn instead of manually
],
dataSource: [
{ name: "Jane Doe", age: 30, quote: "I like Pi." },
{ name: "John Doe", age: 33, quote: "The FitnessGram™ Pacer Test ... ding" }
],
scrollable: true,
width: 'auto'
});
$("#grid2").kendoGrid({
columns: [
{ field: "name", width: 100 },
{ field: "age", width : 50 },
{ field: "quote", width: 93 }//this width should be set by autoFitColumn instead of manually
],
dataSource: [
{ name: "Jane Doe", age: 30, quote: "I like Pi." },
{ name: "John Doe", age: 33, quote: "I like Pi too" }
],
scrollable: true,
width: 'auto'
});
//I left this code in a comment to make switching back and forth between my desired and actual behavior easier
/*var grid = $("#grid").data("kendoGrid");
var grid2 = $("#grid2").data("kendoGrid");
grid.autoFitColumn("quote");
grid2.autoFitColumn("quote");*/
</script>
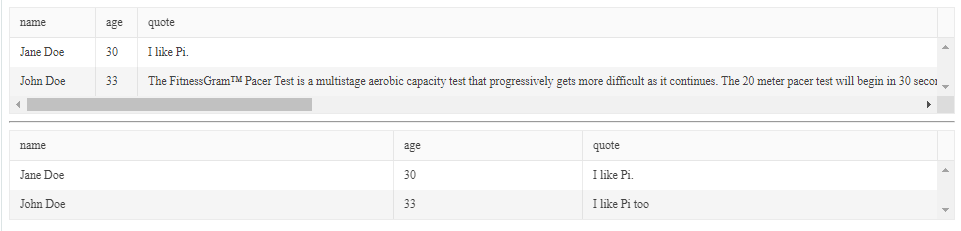
figure 3: desired visual result, but the width should be set using autoFitColumn, not manualy
Neli
Telerik team
answered
on
05 Jul 2021
1 answer
206 views
Hi Team,
This is regarding the subjected issue with in our application where we are unable to drag one particular cell value to adjacent/the same/or horizontal cells' , am attaching the replication for the same(file name : bugreplicationhelper.zip), so, could you help us or correct, if some more information needed from us on the same.

Dimitar
Telerik team
answered
on
05 Jul 2021
1 answer
170 views
Why does the Yaxis display on right side of area chart?
The vertical scale show up on the right-hand side no matter what I do. and the chart is blank even though series items were populated
Georgi Denchev
Telerik team
answered
on
05 Jul 2021
1 answer
245 views
Is there a way to increase performance of dragging down a cell to the point where the page has to scroll? Dragging is so fast until I get to the last row currently in view. As soon as scroll down is activated by my drag, the speed decreases and it takes about 2 minutes to drag down 350 rows.
Veselin Tsvetanov
Telerik team
answered
on
02 Jul 2021
1 answer
288 views
Hi there,
I would like to use the MultiSelect to set the value of a cell in a TreeList.
My code almost works, but once the MultiSelect closes the values displayed in the grid are not what I expected.
I tried using a template to display selected values, but it doesn't look right.
Here is a dojo link https://dojo.telerik.com/OdAFErap/11 and below the code of that dojo
Thanks in advance,
<!DOCTYPE html>
<html>
<head>
    <base href="https://demos.telerik.com/kendo-ui/treelist/local-data-binding">
    <style>html { font-size: 14px; font-family: Arial, Helvetica, sans-serif; }</style>
    <title></title>
    <link rel="stylesheet" href="https://kendo.cdn.telerik.com/2021.2.616/styles/kendo.default-v2.min.css" />

    <script src="https://kendo.cdn.telerik.com/2021.2.616/js/jquery.min.js"></script>


    <script src="https://kendo.cdn.telerik.com/2021.2.616/js/kendo.all.min.js"></script>


</head>
<body>
            <div id="example">
            <div id="treelist"></div>

            <script type="text/kendo" id="alertsTemplate">
               # if (Alerts) { #
              <ul>
                # for(var i = 0; i< Alerts.length; i++){ #
                <li>#: Alerts[i].name #</li>
                # } #
              </ul>
              # } #
            </script>


            <script>
              $(document).ready(function () {

                var AlertsList = [
                  { code: '9', name: 'Black' },
                  { code: '5', name: 'Red' },
                  { code: '5', name: 'Yello' },
                  { code: '3', name: 'Blue' },
                  { code: '1', name: 'Green' }
                ];

                var alertsEditor = (container, options) => {
                  $('<input name="Alerts">')
                      .appendTo(container)
                      .kendoMultiSelect({
                        dataValueField: "code",
                        dataTextField: "name",
                        dataSource: AlertsList
                      });
                };

                    var dataSource = new kendo.data.TreeListDataSource({
                      data: [
                          { id: 1, Name: "Daryl Sweeney", Alerts: null, parentId: null },
                          { id: 2, Name: "Guy Wooten", Alerts: null, parentId: 1 },
                          { id: 32, Name: "Buffy Weber", Alerts: null, parentId: 2 },
                          { id: 11, Name: "Hyacinth Hood", Alerts: null, parentId: 32 },
                          { id: 60, Name: "Akeem Carr", Alerts: null, parentId: 11 },
                          { id: 78, Name: "Rinah Simon", Alerts: null, parentId: 11 },
                          { id: 42, Name: "Gage Daniels", Alerts: null, parentId: 32 },
                          { id: 43, Name: "Constance Vazquez", Alerts: null, parentId: 32 },
                          { id: 46, Name: "Darrel Solis", Alerts: null, parentId: 43 },
                          { id: 47, Name: "Brian Yang", Alerts: null, parentId: 46 },
                          { id: 50, Name: "Lillian Bradshaw", Alerts: null, parentId: 46 },
                          { id: 51, Name: "Christian Palmer", Alerts: null, parentId: 46 },
                          { id: 55, Name: "Summer Mosley", Alerts: null, parentId: 46 },
                          { id: 56, Name: "Barry Ayers", Alerts: null, parentId: 46 },
                          { id: 59, Name: "Keiko Espinoza", Alerts: null, parentId: 46 },
                          { id: 61, Name: "Candace Pickett", Alerts: null, parentId: 46 }
                        ],
                        schema: {
                            model: {
                                id: "id",
                                expanded: true,
                              	fields: {
                                  	Name:   { type: "string", editable: false },
                                  	Alerts: { type: "string", editable: true }
                                }
                            }
                        }
                    });

                $("#treelist").kendoTreeList({
                        dataSource: dataSource,
                        height: 540,
		                		batch: true,
                        editable: "inline",
                        columns: [
                            "Name",
                            {
                              field: "Alerts",
                              editor: alertsEditor,
                              template: $("#alertsTemplate").html()
                            },
                            { command: ["edit"] }
                        ]
                    });
                });
            </script>
        </div>


</body>
</html>
Martin
Telerik team
answered
on
02 Jul 2021
1 answer
337 views
I am using the spreadsheet component and need to partially update my datasource from the server prior to submit.
Basically I have 350 rows in the spreadsheet. I send some (those that have been edited) to the server via ajax where some additional fields are populated. Then those records are sent back to the client side and the user keeps editing before submitting later. On Ajax success I need to update my datasource based on the changes from the server.
Currently in js I am looping through the returned rows, finding them in the datasource, and updating each cell with the new value from the server using datasource.set(). The problem is that this is extremely slow for a few hundred rows. I found this forum answer that is very similar to my situation, except this person is using the grid instead of the spreadsheet.
https://www.telerik.com/forums/modifying-datasource-values-is-very-slow-with-bigger-data-sets
I tried setting my cell values with = instead of set() and then calling $("#spreadsheet").data("kendoSpreadsheet").refresh(); but the spreadsheet rows are not redrawn, even though datasource is reflecting the updated values. I can't use dataSource.sync() because the rows aren't ready to be submitted. I've also tried using dataSource.pushUpdate(<returned from server rows>) which works, but clears out all of the dirty flags by design, meaning I'd need to reset them manually (also slow).
Are there any other options for doing a partial update of a datasource quickly and maintining dirty flags?
Veselin Tsvetanov
Telerik team
answered
on
01 Jul 2021
1 answer
250 views
In the download portal, I can only find the kendoui.for.jquery.2021.2.616.commercial-source is fully version.
But the interesting fact is the trial version contains minify version, but I do not sure if that fully matches the commercial version.
But the interesting fact is the trial version contains minify version, but I do not sure if that fully matches the commercial version.
Martin
Telerik team
answered
on
01 Jul 2021


