Series
The document model can automatically construct series of data using a specified pattern or data that is already in the worksheet. The Auto Fill feature can continue series of numbers, dates, time periods, or number and text combinations based on start and step values. The automatic fill supports the following series: linear, growth, date, and auto fill.
To use the auto fill feature, first create a CellSelection for the range of cells that you want to populate. Note that the range must include the starting values of the series. The CellSelection offers the following methods for series construction:
-
FillDataSeriesLinear: Calculates the value of each cell after the initial values by adding a specific
Stepvalue to the value of the previous cell. -
FillDataSeriesLinearTrend: Calculates the values of the series using a linear fitting algorithm for finding the best line for the initial values.
-
FillDataSeriesExponential: Calculates the values of each cell after the initial values by multiplying the value of the previous cell by a specific
Stepvalue. -
FillDataSeriesExponentialTrend: Calculates the values of the series using an exponential fitting algorithm for finding the best exponential curve for your initial values.
-
FillDataSeriesDate: Fills date values incrementally using a specific
Stepvalue that can represent the number of days, weekdays, months, or years. -
FillDataSeriesAuto: Automatically continues complex patterns of numbers, number and text combinations, dates, or time periods. Typically, it uses a linear fitting algorithm to find the next value of the series.
The following sections contain detailed information and examples for each of these methods.
Linear Series
The FillDataSeriesLinear() method of the CellSelection class constructs linear series of data. The method has two required and one optional parameters. The first parameter is of type CellOrientation and indicates whether the series are oriented horizontally or vertically. The second parameter determines the step value added to each cell to continue the series. The optional parameter stops the series at a certain value. If this parameter is set and the series reaches the specified stop value, all subsequent cells are left empty.
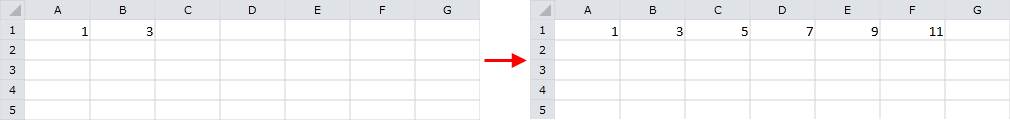
Example 1 creates a new worksheet that has the value 1 in cell A1 and 3 in B1. The FillDataSeriesLinear() method is invoked for the cell region A1:F1. The values 1, 3, 5, 7, 9, and 11 appear in the range A1:F1.
Example 1: Fill Linear Series
Workbook workbook = new Workbook();
Worksheet worksheet = workbook.Worksheets.Add();

worksheet.Cells[0, 0].SetValue(1);
worksheet.Cells[0, 1].SetValue(3);

CellRange range = new CellRange(0, 0, 0, 5);
worksheet.Cells[range].FillDataSeriesLinear(CellOrientation.Horizontal, 2);
Figure 1 demonstrates the result of Example 1.
Figure 1: Linear series
Linear Trend Series
The FillDataSeriesLinearTrend() method produces series using a linear fitting algorithm for finding the best line for the initial values pattern. The method requires a single argument of type CellOrientation that determines if the series are oriented horizontally or vertically.
Example 2 shows how to use FillDataSeriesLinearTrend() to continue series values 1, 5 from the range A1:B1. The result is the series 1, 5, 9, 13, 17, 21 in the range A1:F1.
Example 2: Fill Linear Trend Series
Workbook workbook = new Workbook();
Worksheet worksheet = workbook.Worksheets.Add();

worksheet.Cells[0, 0].SetValue(1);
worksheet.Cells[0, 1].SetValue(8);
worksheet.Cells[0, 2].SetValue(3);
worksheet.Cells[0, 3].SetValue(10);
worksheet.Cells[0, 4].SetValue(5);

CellRange range = new CellRange(0, 0, 0, 9);
worksheet.Cells[range].FillDataSeriesLinearTrend(CellOrientation.Horizontal);
Figure 2 demonstrates the result of Example 2.
Figure 2: Linear trend series
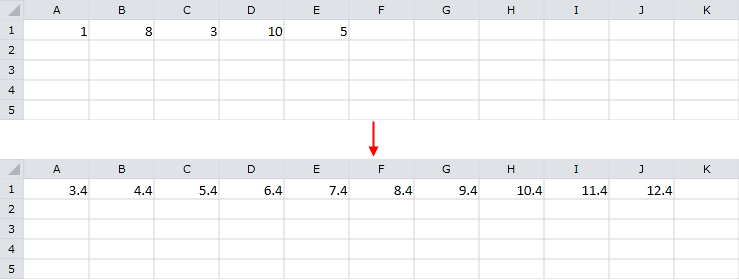
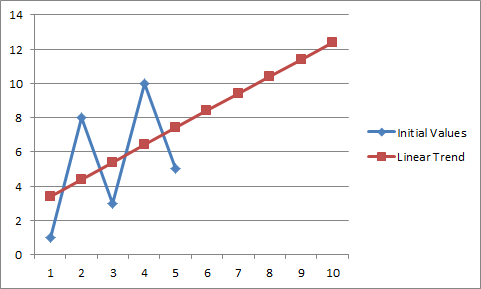
Figure 3 illustrates the difference between the initial values and the result. Note that the result values construct the best fit line for the initial data.
Figure 3: Differences Between Initial Values and Linear Trend
Exponential Series
The FillDataSeriesExponential() method calculates the values of each cell after the initial value by multiplying the contents of the previous cell by a specified step value. Like FillDataSeriesLinear(), the method has two required and one optional parameters. The first is of type CellOrientation and determines whether the orientation of the series is horizontal or vertical. The second argument is a double value that indicates the step between each two consecutive values of the series. The optional parameter specifies the stop value of the series and stops the series when a certain value is reached.
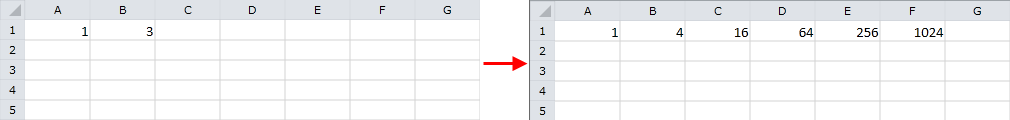
Example 3 shows how to use the FillDataSeriesExponential() method to continue series with initial values 1 and 3 that appear in cells A1 and B1 respectively. After the method is invoked, the region A1:F1 contains the following values: 1, 4, 16, 64, 256, and 1024.
Example 3: Fill Exponential Series
Workbook workbook = new Workbook();
Worksheet worksheet = workbook.Worksheets.Add();

worksheet.Cells[0, 0].SetValue(1);
worksheet.Cells[0, 1].SetValue(3);

CellRange range = new CellRange(0, 0, 0, 5);
worksheet.Cells[range].FillDataSeriesExponential(CellOrientation.Horizontal, 4);
Figure 4 demonstrates the result of Example 3.
Figure 4: Exponential series
Exponential Trend Series
The FillDataSeriesExponentialTrend() method calculates the values of the series using an exponential fitting algorithm for finding the best exponential curve for the initial values. It requires a single argument of type CellOrientation that indicates if the series are horizontal or vertical.
Example 4 shows how to use the FillDataSeriesExponentialTrend() method to continue series with initial values 1 and 5 that appear in cells A1 and B1 respectively. After the exponential trend is applied, the range A1:F1 holds the following values: 1, 5, 25, 125, 625, and 3125.
Example 4: Exponential Trend Series
Workbook workbook = new Workbook();
Worksheet worksheet = workbook.Worksheets.Add();

worksheet.Cells[0, 0].SetValue(1);
worksheet.Cells[0, 1].SetValue(5);
worksheet.Cells[0, 2].SetValue(2);
worksheet.Cells[0, 3].SetValue(9);

CellRange range = new CellRange(0, 0, 0, 5);
worksheet.Cells[range].FillDataSeriesExponentialTrend(CellOrientation.Horizontal);
Figure 5 demonstrates the result of Example 4.
Figure 5: Exponential trend series
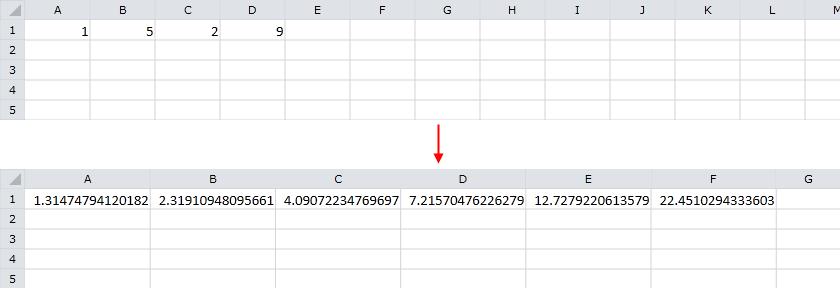
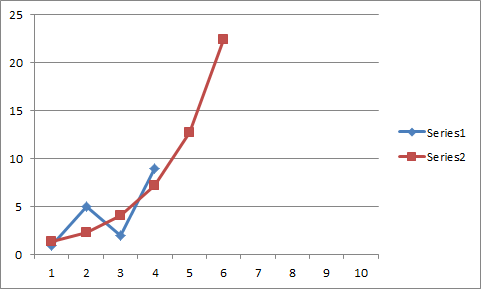
Figure 6 plots two series that contain the initial and result values respectively. Note that the result values form the best fit exponential curve for the initial data.
Figure 6: Differences Between Initial Values and Exponential Trend
Date Series
The FillDataSeriesDate() method fills date values incrementally using a specific Step that represents the number of days, weekdays, months, or years added to each consecutive value. The method has three required and one optional parameters. The first required argument is of type CellOrientation and indicates if the series are horizontal or vertical. The second argument is of type DateUnitType and determines the type of the step value – day, weekday, month, or year. The third required parameter specifies the step added to each consecutive value. The fourth argument is optional and specifies the stop value of the series. If this parameter is set and the series reaches the specified stop value, all subsequent cells are left empty.
Example 5 shows how to construct series that use 5/28/2013 as a starting point and add two weekdays for each consecutive value.
Example 5: Fill Date Series
Workbook workbook = new Workbook();
Worksheet worksheet = workbook.Worksheets.Add();

worksheet.Cells[0, 0].SetValue(new DateTime(2013, 5, 28));

CellRange range = new CellRange(0, 0, 0, 9);
worksheet.Cells[range].FillDataSeriesDate(CellOrientation.Horizontal, DateUnitType.Weekday, 2);
Figure 7 demonstrates the result of Example 5.
Figure 7: Date series
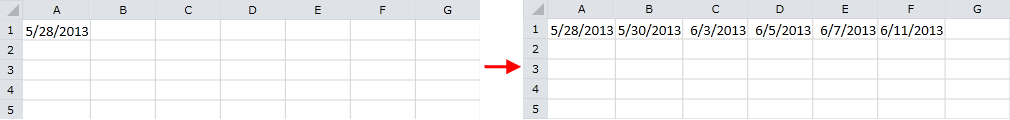
A closer look at the result shows that 5/28/2013 is Tuesday, 5/30/2013 is Thursday, 6/3/2013 is Monday, 6/5/2013 is Wednesday, 6/7/2013 is Friday, and 6/11/2013 is Tuesday. All of the result dates are weekdays and the step between them is exactly two workdays.
Auto Fill Series
The FillDataSeriesAuto() method automatically constructs complex patterns of numbers, number and text combinations, dates, or time periods. For most cases it uses a linear fitting algorithm to find the next value of the series. The method can fill different types of data automatically. For example, if you input 1, 2, and 3 in consecutive cells and use AutoFill, the result is 4, 5, 6, and 7. The following table lists supported data for auto fill:
|
Initial Selection |
Extended Series |
|---|---|
|
1, 2, 3 |
4, 5, 6… |
|
9:00 |
10:00, 11:00, 12:00… |
|
Mon |
Tue, Wed, Thu… |
|
Monday |
Tuesday, Wednesday, Thursday… |
|
Jan |
Feb, Mar, Apr… |
|
Jan, Apr |
Jul, Oct, Jan… |
|
15-Jan, 15-Apr |
15-Jul, 15-Oct… |
|
2007, 2008 |
2009, 2010, 2011… |
|
Q3 |
Q4, Q1, Q2… |
|
Quarter3 |
Quarter4, Quarter1, Quarter2… |
|
text1, textA |
text2, textA, text3, textA… |
|
Product 1 |
Product 2, Product 3… |
If you invoke
FillDataSeriesAuto()for data that does not appear in the table, the method repeats its initial values.
Similarly to the other auto fill methods, FillDataSeriesAuto() takes three arguments. The first parameter is called seriesOrientation and is of type CellOrientation. It determines if the series are oriented horizontally or vertically. The second argument specifies the direction of the fill. For example, you can select values from cell A1 to F1 or from cell F1 to A1. The third parameter is optional and defines the number of initial values of the series to use for generating the entire series.
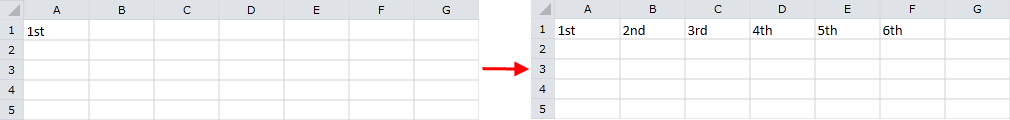
Example 6 shows how to use the FillDataSeriesAuto() method for the initial value 1st set in cell A1. The resulting series filled in the range A1:F1 are: 1st, 2nd, 3rd, 4th, 5th, and 6th.
Example 6: Auto Fill
Workbook workbook = new Workbook();
Worksheet worksheet = workbook.Worksheets.Add();

worksheet.Cells[0, 0].SetValue("1st");

CellRange range = new CellRange(0, 0, 0, 5);
worksheet.Cells[range].FillDataSeriesAuto(CellOrientation.Horizontal, true);
Figure 8 demonstrates the result of Example 6.
Figure 8: Auto fill
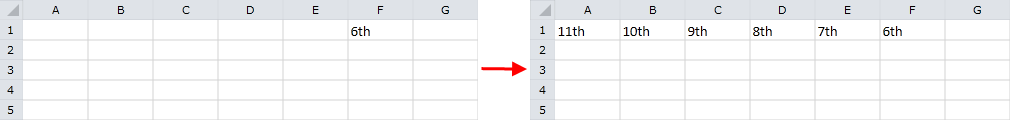
Example 7 demonstrates the behavior of the FillDataSeriesAuto() method. This time, the initial value 6th appears in cell F1 and the applied auto fill is with reversed direction. Note that the constructed CellRange is F1:A1, instead of A1:F1. The resulting series are: 11th, 12th, 9th, 8th, 7th, and 6th.
Example 7: Auto Fill Reversed Direction
Workbook workbook = new Workbook();
Worksheet worksheet = workbook.Worksheets.Add();

worksheet.Cells[0, 5].SetValue("6th");

CellRange range = new CellRange(0, 5, 0, 0);
worksheet.Cells[range].FillDataSeriesAuto(CellOrientation.Horizontal, true);
Figure 9 demonstrates the result of Example 7.
Figure 9: Auto fill reversed direction