Title and Legend
You can manipulate the legend and the title of a chart.
Title
You can access and set the Title property of the DocumentChart object, which is of type Title. The Title property is exposed in both the DocumentChart and SeriesBase classes. Similar to the series of the chart, the title can be a simple string value or a reference to data. The reference is not to a CellIndex, but to a CellRange. If the CellRange contains more than one cell, the values of the cells are concatenated.
Example 1: Set the chart title from a string
FloatingChartShape chartShape = new FloatingChartShape(worksheet, new CellIndex(0, 4), new CellRange(1, 1, 5, 2), ChartType.Pie)
{
Width = 460,
Height = 250
};
DocumentChart chart = chartShape.Chart;
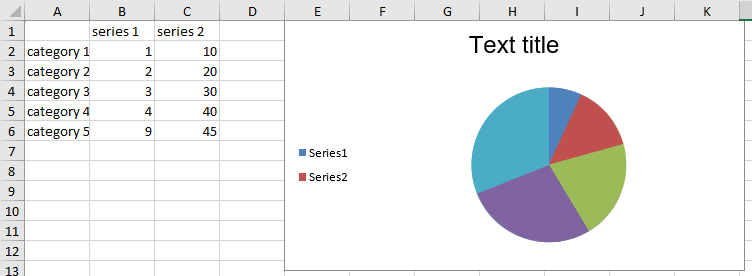
chart.Title = new TextTitle("Text title");Example 2: Set a series title from a cell range
BarSeriesGroup columnGroup = chart.SeriesGroups.First() as BarSeriesGroup;
SeriesBase firstSeries = columnGroup.Series.First();

firstSeries.Title = new FormulaTitle(new WorkbookFormulaChartData(worksheet, new CellRange(0, 0, 0, 1)));
Figure 1: Pie chart with a text-based chart title
Legend
The charts use a legend to help users understand the data plotted on the chart.
You can add or edit the legend of the chart through the Legend property of the DocumentChart object. The property is of type Legend. The Legend type contains one property: LegendPosition of type LegendPosition, which is an enumeration with four members: Top, Bottom, Left, and Right. The actual entries of the legend are constructed by the titles of the series.
Example 3: Add and position a chart legend
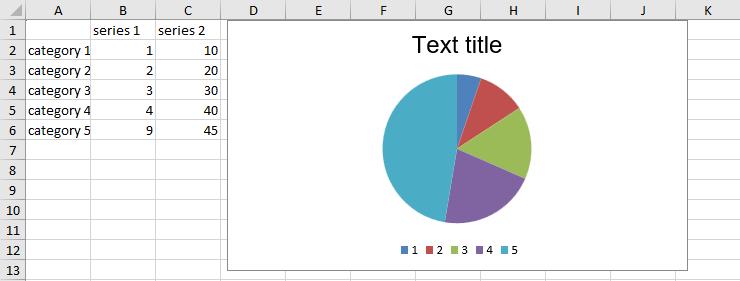
chart.Legend = new Legend();
chart.Legend.Position = LegendPosition.Left;
Figure 2: Pie chart with a legend built from the series titles