Generating Stacked Line Charts and Configuring Axes in Excel Using FloatingChartShape
Environment
| Version | Product | Author |
|---|---|---|
| 2025.3.806 | SpreadProcessing | Yoan Karamanov |
Description
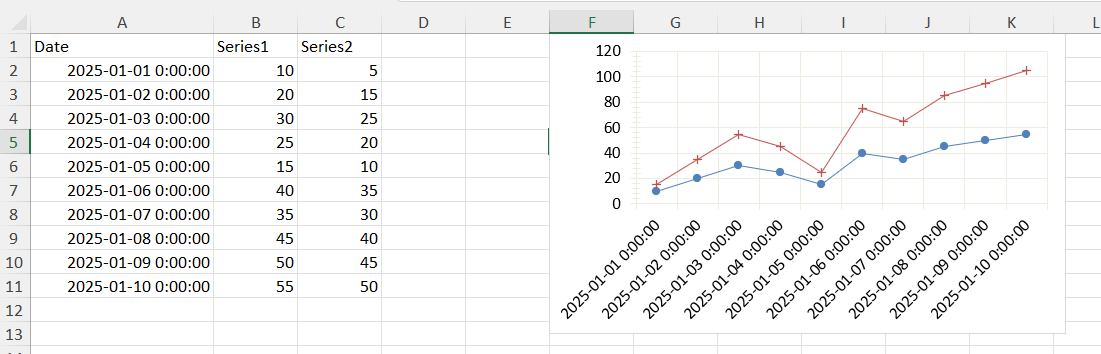
This article shows how to generate stacked line charts in worksheets with the SpreadProcessing library. It also covers how to specify the data sources for the X-axis (dates) and Y-axis (numerical values). It explains how to configure chart properties such as marker types, line styles, and visibility to customize the chart appearance.
Key topics addressed in this guide include:
-
Creating line and stacked line charts in Excel with Telerik Document Processing
-
Assigning specific data ranges to the X-axis (for example, dates) and Y-axis (numerical values)
-
Customizing chart properties, including marker types for each series, line styles, and removing markers when needed
-
Plotting multiple columns of data while ensuring correct alignment between axes
Solution
To create a stacked line chart and configure the axes as desired, follow these steps:
- Define the
LineSeriesGroupand set its grouping toStacked. This ensures the chart is created as a stacked line chart. - Create individual
LineSeriesfor each data column. Set theValuesto represent numerical data andCategoriesto represent dates. - Define the axes for the chart. Set the
CategoryAxisto plot dates and theValueAxisfor numerical values. - Create the chart and associate the
LineSeriesGroupand axes with it. - Replace the default chart in the
FloatingChartShapewith the configured document chart. Set the dimensions and add it to the worksheet.
var fileBytes = File.ReadAllBytes("fileWithChartData.xlsx");

XlsxFormatProvider xlsxFormatProvider = new XlsxFormatProvider();

Workbook workbook = xlsxFormatProvider.Import(fileBytes, null);
Worksheet worksheet = workbook.ActiveWorksheet;

LineSeriesGroup seriesGroup = new LineSeriesGroup();
seriesGroup.Grouping = SeriesGrouping.Stacked;

// Make the series one by one
LineSeries lineSeries1 = new LineSeries();
lineSeries1.Values = new WorkbookFormulaChartData(worksheet, new CellRange(1, 1, 10, 1));
lineSeries1.Categories = new WorkbookFormulaChartData(worksheet, new CellRange(1, 0, 10, 0));
lineSeries1.Marker = new Marker();
lineSeries1.Marker.Symbol = MarkerStyle.Circle;
seriesGroup.Series.Add(lineSeries1);

LineSeries lineSeries2 = new LineSeries();
lineSeries2.Values = new WorkbookFormulaChartData(worksheet, new CellRange(1, 2, 10, 2));
lineSeries2.Categories = new WorkbookFormulaChartData(worksheet, new CellRange(1, 0, 10, 0));
lineSeries2.Marker = new Marker();
lineSeries2.Marker.Symbol = MarkerStyle.Plus;
seriesGroup.Series.Add(lineSeries2);

// Define the axes.
SolidFill lineColor = new SolidFill(new ThemableColor(ThemeColorType.Background2));

AxisGroup axisGroup = new AxisGroup();
CategoryAxis categoryAxis = new CategoryAxis();
categoryAxis.Outline.Fill = lineColor;
categoryAxis.MajorGridlines.Outline.Fill = lineColor;
axisGroup.CategoryAxis = categoryAxis;

ValueAxis valueAxis = new ValueAxis();
valueAxis.Outline.Fill = lineColor;
valueAxis.MajorGridlines.Outline.Fill = lineColor;
axisGroup.ValueAxis = valueAxis;

// Create the chart and assign the series group and axes.
DocumentChart documentChart = new DocumentChart();
documentChart.SeriesGroups.Add(seriesGroup);
documentChart.PrimaryAxes = axisGroup;

// Create a placeholder FloatingChartShape and replace the inner chart.
FloatingChartShape floatingChartShape = new FloatingChartShape(worksheet, new CellIndex(0, 5), new CellRange(0, 0, 4, 3), ChartType.Line);
floatingChartShape.Chart = documentChart;
floatingChartShape.Width = 400;
floatingChartShape.Height = 250;

worksheet.Charts.Add(floatingChartShape);

string exportFileName = "fileWithChart.xlsx";
using (Stream str = File.OpenWrite(exportFileName))
{
    xlsxFormatProvider.Export(workbook, str, null);
}
Follow these steps to generate a stacked line chart without markers and configure the axes to display the required data.