WinUI Sparkline Overview
RadSparkline is a set of controls that show an information graphic. The controls are characterized by small size, excellent performance and lightweight. By definition, the sparkline is mainly used to outline trends. However, it is very flexible in terms of data points generation and can contain from just a few points, to as many as thousands of data points.
In terms of data visualization, RadSparkline is comparable to RadCartesianChart. However, in order to maximize performance, the sparklines do not utilize this many visual indicators. They also don't use an x or y axis, or multiple axes.
Key Features
-
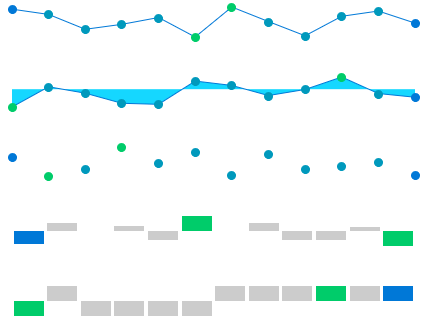
Different visualization types: You can use the controls from the sparkline suite to visualize your data using line, points, bars, etc. Read more about this in the Sparkline Types article.
-
Indicators: The indicators are visual markers that can be used to annotate the data point positions or highlight values from the plotted data. Read more about this in the Indicators article.
-
Horizontal axis: The sparkline allows you to draw a horizontal axis that can be used to annotate the data trend. Read more about this in the Axis article.
Check out the Getting Started help article that shows how to use the controls in a basic scenario.
Telerik UI for WinUI Support and Learning Resources
- Telerik UI for WinUI Sparkline Homepage
- Get Started with the Telerik UI for WinUI Sparkline
- Telerik UI for WinUI API Reference
- Getting Started with Telerik UI for WinUI Components
- Telerik UI for WinUI Sparkline Forums