New to Telerik UI for WinUI? Start a free 30-day trial
Label Definitions
Updated on Mar 26, 2026
If you wish to customize the default labels of the chart series, you can use a ChartSeriesLabelDefinition.
To see labels in the series you have to set the ShowLabels property to True.
More than one label definition can be set on each series by adding ChartSeriesLabelDefinition items to the LabelDefinitions collection of the chart series (see the Example below).
Properties
The ChartSeriesLabelDefinition class exposes the following properties:
- Binding: Gets or sets the DataPointBinding instance that will retrieve the content of each label.
- Format: Gets or sets the string used to format the label content, using the String.Format method.
- Margin: Gets or sets the offset of each label from the four box edges.
- HorizontalAlignment: Gets or sets the horizontal alignment of each label relative to the DataPoint it is associated with.
- VerticalAlignment: Gets or sets the vertical alignment of each label relative to the DataPoint it is associated with.
- LabelTemplate: Gets or sets the DataTemplate instance that may be used to define custom labels.
- LabelTemplateSelector: Gets or sets the DataTemplateSelector instance that may be used to provide context-specific data templates, depending on the provided DataPoint.
- DefaultVisualStyle: Gets or sets the Style instance that defines the default appearance of the labels. The Style should target the TextBlock type.
- Strategy: Gets or sets a custom ChartSeriesLabelStrategy instance that may be used to override the labels' appearance, content and layout.
Example
This example shows how to bind the label's content to a custom property from your business model.
Example 1: Defining the model
C#
public class Data
{
	public string Category { get; set; }

	public double Value { get; set; }

	public string LabelProperty { get; set; }
}
Example 2: Populating with data
C#
public sealed partial class MainPage : Page
{
public MainPage()
{
this.InitializeComponent();
this.myChart.Series[0].ItemsSource = CreateData();
}
public List<Data> CreateData()
{
List<Data> collection = new List<Data>();
collection.Add(new Data { Category = "Apples", Value = 10, LabelProperty = "First Point" });
collection.Add(new Data { Category = "Oranges", Value = 8, LabelProperty = "Second Point" });
collection.Add(new Data { Category = "Pineapples", Value = 21, LabelProperty = "Third Point" });
return collection;
}
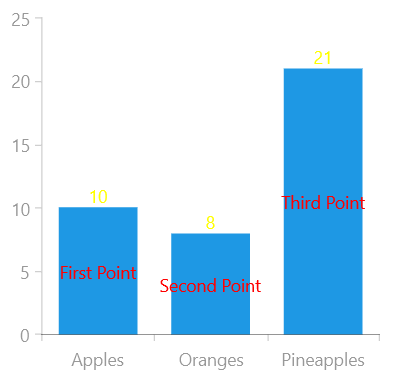
}Example 3: Defining the RadCartesianChart and LabelDefinitions
XAML
 <Grid xmlns:telerikChart="using:Telerik.UI.Xaml.Controls.Chart">
	<telerikChart:RadCartesianChart  x:Name="myChart" Width="300" Height="300">
		<telerikChart:RadCartesianChart.VerticalAxis>
			<telerikChart:LinearAxis/>
		</telerikChart:RadCartesianChart.VerticalAxis>

		<telerikChart:RadCartesianChart.HorizontalAxis>
			<telerikChart:CategoricalAxis/>
		</telerikChart:RadCartesianChart.HorizontalAxis>

		<telerikChart:BarSeries ShowLabels="True">
			<telerikChart:BarSeries.LabelDefinitions>
				<telerikChart:ChartSeriesLabelDefinition x:Name="myDef" HorizontalAlignment="Center" VerticalAlignment="Center"  >
					<telerikChart:ChartSeriesLabelDefinition.Binding>
						<telerikChart:PropertyNameDataPointBinding PropertyName="LabelProperty" />
					</telerikChart:ChartSeriesLabelDefinition.Binding>
					<telerikChart:ChartSeriesLabelDefinition.DefaultVisualStyle>
						<Style TargetType="TextBlock">
							<Setter Property="Foreground" Value="Red" />
						</Style>
					</telerikChart:ChartSeriesLabelDefinition.DefaultVisualStyle>
				</telerikChart:ChartSeriesLabelDefinition>
				<telerikChart:ChartSeriesLabelDefinition x:Name="otherDef" HorizontalAlignment="Center" VerticalAlignment="Top" >
					<telerikChart:ChartSeriesLabelDefinition.Binding>
						<telerikChart:PropertyNameDataPointBinding PropertyName="Value" />
					</telerikChart:ChartSeriesLabelDefinition.Binding>
					<telerikChart:ChartSeriesLabelDefinition.DefaultVisualStyle>
						<Style TargetType="TextBlock">
							<Setter Property="Foreground" Value="Yellow" />
						</Style>
					</telerikChart:ChartSeriesLabelDefinition.DefaultVisualStyle>
				</telerikChart:ChartSeriesLabelDefinition>
			</telerikChart:BarSeries.LabelDefinitions>

			<telerikChart:BarSeries.CategoryBinding>
				<telerikChart:PropertyNameDataPointBinding PropertyName="Category"/>
			</telerikChart:BarSeries.CategoryBinding>
			<telerikChart:BarSeries.ValueBinding>
				<telerikChart:PropertyNameDataPointBinding PropertyName="Value"/>
			</telerikChart:BarSeries.ValueBinding>
		</telerikChart:BarSeries>
	</telerikChart:RadCartesianChart>
</Grid>
Figure 1: Result from Example 3