New to Telerik UI for WinUI? Start a free 30-day trial
Display Horizontal Bar Chart
Updated on Mar 26, 2026
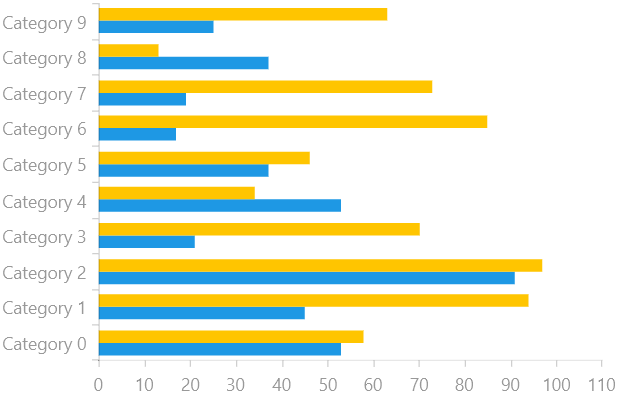
RadChart allows a series to be rendered vertically as well as horizontally. The position of a series depends on the axes that are defined. Thus in order to display a BarSeries horizontally, you need to define the category axis as a vertical axis, rather than a horizontal axis.
Define a Bar Chart with a Horizontal Series
Examples 1 and 2 demonstrate how to create a RadCartesianChart with a horizontal BarSeries by switching the Vertical and Horizontal axes.
Example 1: Defining the model and populating with data
C#
public sealed partial class MainPage : Page
{
	public MainPage()
	{
		this.InitializeComponent();

		this.DataContext = new SampleViewModel();
	}
}

public class SampleViewModel
{
	private Random r = new Random();

	public IEnumerable Data1 { get; private set; }
	public IEnumerable Data2 { get; private set; }


	public SampleViewModel()
	{
		this.Data1 = (from c in Enumerable.Range(0, 10)
					  select new SampleData
					  {
						  Category = "Category " + c,
						  Value = r.Next(10, 100)
					  }).ToList();

		this.Data2 = (from c in Enumerable.Range(0, 10)
					  select new SampleData
					  {
						  Category = "Category " + c,
						  Value = r.Next(10, 100)
					  }).ToList();
	}
}

public class SampleData
{
	public double Value { get; set; }
	public string Category { get; set; }
}
Example 2: Populating the PointTemplates
XAML
<Grid xmlns:telerikChart="using:Telerik.UI.Xaml.Controls.Chart">
	<telerikChart:RadCartesianChart PaletteName="DefaultLight">
		<telerikChart:RadCartesianChart.HorizontalAxis>
			<telerikChart:LinearAxis/>
		</telerikChart:RadCartesianChart.HorizontalAxis>
		<telerikChart:RadCartesianChart.VerticalAxis>
			<telerikChart:CategoricalAxis/>
		</telerikChart:RadCartesianChart.VerticalAxis>
		<telerikChart:BarSeries CombineMode="Cluster" ItemsSource="{Binding Data1}">
			<telerikChart:BarSeries.ValueBinding>
				<telerikChart:PropertyNameDataPointBinding PropertyName="Value"/>
			</telerikChart:BarSeries.ValueBinding>
			<telerikChart:BarSeries.CategoryBinding>
				<telerikChart:PropertyNameDataPointBinding PropertyName="Category"/>
			</telerikChart:BarSeries.CategoryBinding>
		</telerikChart:BarSeries>
		<telerikChart:BarSeries CombineMode="Cluster" ItemsSource="{Binding Data2}">
			<telerikChart:BarSeries.ValueBinding>
				<telerikChart:PropertyNameDataPointBinding PropertyName="Value"/>
			</telerikChart:BarSeries.ValueBinding>
			<telerikChart:BarSeries.CategoryBinding>
				<telerikChart:PropertyNameDataPointBinding PropertyName="Category"/>
			</telerikChart:BarSeries.CategoryBinding>
		</telerikChart:BarSeries>
	</telerikChart:RadCartesianChart>
</Grid>
Figure 1: Horizontal BarSeries