New to Telerik UI for WinUI? Start a free 30-day trial
Inverse Axes
Updated on Mar 26, 2026
The RadChart control supports inverse axes. Depending on the axis type there are different properties that specify whether the axis will be inverse or not.
- IsInverse (bool): Defines the plot direction of all axes that inherit from the LineAxis abstract class:
- SweepDirection (SweepDirection): Defines the plot direction of all axes that inherit from the RadialAxis abstract class:
The alternative for inverse axes for RadPieChart is represented by the AngleRange property.
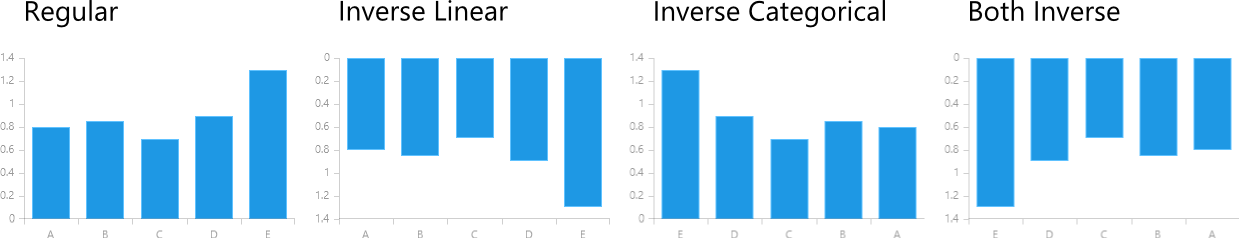
Example for Cartesian chart
Example 1 shows how to invert both axes in a RadCartesianChart.
Example 1: Inverse axes in RadCartesianChart
XAML
<Grid xmlns:telerikChart="using:Telerik.UI.Xaml.Controls.Chart"
	xmlns:telerikCharting="using:Telerik.Charting">
	<telerikChart:RadCartesianChart>
		<telerikChart:RadCartesianChart.VerticalAxis>
			<telerikChart:LinearAxis IsInverse="True"/>
		</telerikChart:RadCartesianChart.VerticalAxis>
		<telerikChart:RadCartesianChart.HorizontalAxis>
			<telerikChart:CategoricalAxis IsInverse="True"/>
		</telerikChart:RadCartesianChart.HorizontalAxis>

		<telerikChart:BarSeries>
			<telerikChart:BarSeries.DataPoints>
				<telerikCharting:CategoricalDataPoint Category="A" Value="0.8"/>
				<telerikCharting:CategoricalDataPoint Category="B" Value="0.85"/>
				<telerikCharting:CategoricalDataPoint Category="C" Value="0.7"/>
				<telerikCharting:CategoricalDataPoint Category="D" Value="0.9"/>
				<telerikCharting:CategoricalDataPoint Category="E" Value="1.3"/>
			</telerikChart:BarSeries.DataPoints>
		</telerikChart:BarSeries>
	</telerikChart:RadCartesianChart>
</Grid>
Figure 1: Different axes combinations in RadCartesianChart
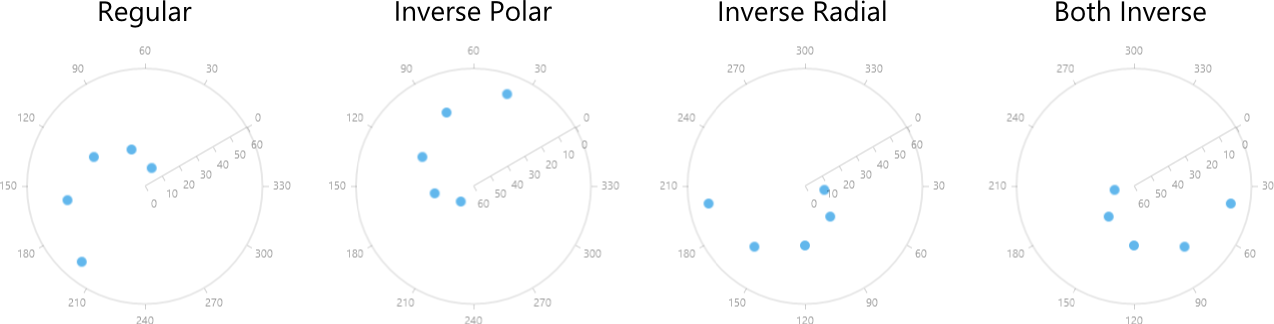
Example for polar chart
Example 2 shows how to invert both axes in a RadPolarChart.
Example 2: Inverse axes in RadPolarChart
XAML
<Grid xmlns:telerikChart="using:Telerik.UI.Xaml.Controls.Chart"
	  xmlns:telerikCharting="using:Telerik.Charting">
	<telerikChart:RadPolarChart StartAngle="30">
		<telerikChart:RadPolarChart.PolarAxis>
			<telerikChart:PolarAxis IsInverse="True"/>
		</telerikChart:RadPolarChart.PolarAxis>
		<telerikChart:RadPolarChart.RadialAxis>
			<telerikChart:NumericalRadialAxis SweepDirection="Clockwise"/>
		</telerikChart:RadPolarChart.RadialAxis>

		<telerikChart:PolarPointSeries>
			<telerikChart:PolarPointSeries.DataPoints>
				<telerikCharting:PolarDataPoint Angle="40" Value="10"/>
				<telerikCharting:PolarDataPoint Angle="80" Value="20"/>
				<telerikCharting:PolarDataPoint Angle="120" Value="30"/>
				<telerikCharting:PolarDataPoint Angle="160" Value="40"/>
				<telerikCharting:PolarDataPoint Angle="200" Value="50"/>
			</telerikChart:PolarPointSeries.DataPoints>
		</telerikChart:PolarPointSeries>
	</telerikChart:RadPolarChart>
</Grid>
Figure 2: Different axes combinations in RadPolarChart