New to Telerik UI for WinUI? Start a free 30-day trial
Custom Line Annotation
Updated on Mar 26, 2026
This topic describes the properties of the CartesianCustomLineAnnotation.
CartesianCustomLineAnnotation Properties
- ClipToPlotArea (bool): Gets or sets a value indicating whether the annotation will be clipped to the bounds of the plot area.
- Label (string): Gets or sets the label of the annotation.
- Stroke (DoubleCollection): Gets or sets the Brush that specifies how the shape outline is painted.
- StrokeThickness (double): Gets or sets the width of the shape stroke outline.
- StrokeDashArray (DoubleCollection): Gets or sets a collection of double values that indicates the pattern of dashes and gaps that is used to outline stroked series.
- HorizontalAxis (CartesianAxis): Gets or sets the horizontal axis that the annotation is associated with. If no axis is specified, the annotation will automatically use the chart's primary horizontal axis.
- VerticalAxis (CartesianAxis): Gets or sets the vertical axis that the annotation is associated with. If no axis is specified, the annotation will automatically use the chart's primary vertical axis.
- HorizontalFrom (object): Gets or sets the start horizontal coordinate of the annotation.
- HorizontalTo (object): Gets or sets the end horizontal coordinate of the annotation.
- VerticalFrom (object): Gets or sets the start vertical coordinate of the annotation.
- VerticalTo (object): Gets or sets the end vertical coordinate of the annotation.
Example of CartesianCustomLineAnnotation
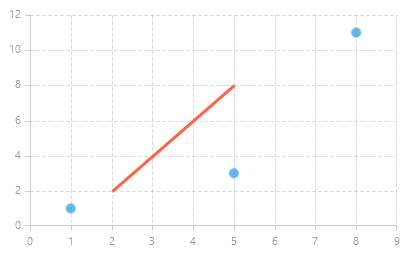
Example 1 demonstrates how to add CartesianCustomLineAnnotation to a RadCartesianChart.
Example 1: CartesianCustomLineAnnotation
XAML
<Grid xmlns:telerikChart="using:Telerik.UI.Xaml.Controls.Chart"
	  xmlns:telerikCharting="using:Telerik.Charting">
	<telerikChart:RadCartesianChart Width="400" Height="250">
		<telerikChart:RadCartesianChart.Annotations>
			<telerikChart:CartesianCustomLineAnnotation HorizontalFrom="2" HorizontalTo="5"
														VerticalFrom="2" VerticalTo="8"
														Stroke="Tomato" StrokeThickness="3"/>
		</telerikChart:RadCartesianChart.Annotations>

		<telerikChart:RadCartesianChart.HorizontalAxis>
			<telerikChart:LinearAxis />
		</telerikChart:RadCartesianChart.HorizontalAxis>
		<telerikChart:RadCartesianChart.VerticalAxis>
			<telerikChart:LinearAxis/>
		</telerikChart:RadCartesianChart.VerticalAxis>
		<telerikChart:ScatterPointSeries>
			<telerikChart:ScatterPointSeries.DataPoints>
				<telerikCharting:ScatterDataPoint XValue="1" YValue="1" />
				<telerikCharting:ScatterDataPoint XValue="5" YValue="3" />
				<telerikCharting:ScatterDataPoint XValue="8" YValue="11" />
			</telerikChart:ScatterPointSeries.DataPoints>
		</telerikChart:ScatterPointSeries>
		<telerikChart:RadCartesianChart.Grid>
			<telerikChart:CartesianChartGrid MajorLinesVisibility="XY" />
		</telerikChart:RadCartesianChart.Grid>
	</telerikChart:RadCartesianChart>
</Grid>
Figure 1: RadCartesianChart with a CartesianCustomLineAnnotation