New to Telerik UI for WinUI? Start a free 30-day trial
Scale Ticks
Updated on Mar 26, 2026
The BulletGraph enables you to control the appearance of its scale ticks.
Tick Interval
To set the interval between two adjacent ticks on the scale, use the TickStep property.
Set the TickStep
XAML
<Grid xmlns:dataVisualization="using:Telerik.UI.Xaml.Controls.DataVisualization">
	<dataVisualization:RadBulletGraph Height="50" Width="300" StartValue="0" EndValue="100" TickStep="25" />
</Grid>
The following image shows a TickStep set to 25.

Styling the Ticks
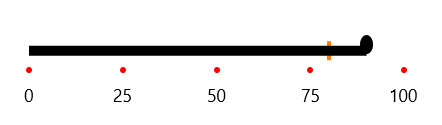
To change the appearance of the scale ticks, use the TickTemplate property.
Set the TickTemplate
XAML
<Grid xmlns:dataVisualization="using:Telerik.UI.Xaml.Controls.DataVisualization">
	<dataVisualization:RadBulletGraph Height="50" Width="300" StartValue="0" EndValue="100" TickStep="25">
		<dataVisualization:RadBulletGraph.TickTemplate>
			<DataTemplate>
				<StackPanel Orientation="Horizontal">
					<Ellipse Fill="Red" Height="5" Width="5"/>
				</StackPanel>
			</DataTemplate>
		</dataVisualization:RadBulletGraph.TickTemplate>
	</dataVisualization:RadBulletGraph>
</Grid>
The following image shows the result.