New to Telerik UI for WinUI? Start a free 30-day trial
Projected Measure
Updated on Mar 26, 2026
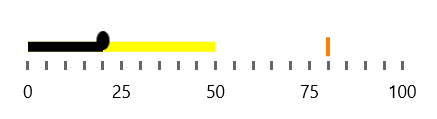
The projected measure is a visual element that allows comparing the progress shown as the featured measure.
The following example demonstrates how to use the ProjectedMeasure and ProjectedMeasureBrush properties to render the projected measure.
Set the ProjectedMeasure
XAML
<Grid xmlns:dataVisualization="using:Telerik.UI.Xaml.Controls.DataVisualization">
	<dataVisualization:RadBulletGraph x:Name="bulletGraph" Width="300" Height="50" StartValue="0" EndValue="100" FeaturedMeasure="20" ProjectedMeasure="50" ProjectedMeasureBrush="Yellow"/>
</Grid>
The following image shows the result.