New to Telerik UI for WinUI? Start a free 30-day trial
Labels
Updated on Mar 26, 2026
The BulletGraph provides options for controlling its scale labels and setting their position, appearance, interval, and more.
Label Interval
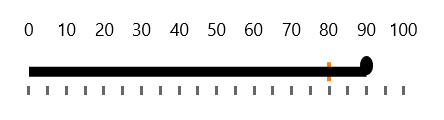
To define the interval between two adjacent labels, set the LabelStep property.
Set the LabelStep
XAML
	<Grid xmlns:dataVisualization="using:Telerik.UI.Xaml.Controls.DataVisualization">
        <dataVisualization:RadBulletGraph Height="50" Width="300" StartValue="0" EndValue="100" LabelStep="10" />
    </Grid>
The following image shows a LabelStep set to 10.

Label Offset
You can position the labels in a relative matter below or above the featured measure by using the LabelOffset property.
Set the LabelOffset
XAML
<Grid xmlns:dataVisualization="using:Telerik.UI.Xaml.Controls.DataVisualization">
	<dataVisualization:RadBulletGraph Height="50" Width="300" StartValue="0" EndValue="100" LabelStep="10" LabelOffset="-50"/>
</Grid>
The following image shows a LabelOffeste set to -50.
Styling the Labels
To change the appearance of the labels, use the LabelTemplate property.
Set the LabelTemplate
XAML
<Grid xmlns:dataVisualization="using:Telerik.UI.Xaml.Controls.DataVisualization">
	<dataVisualization:RadBulletGraph Height="50" Width="300" StartValue="0" EndValue="100" LabelStep="10" >
		<dataVisualization:RadBulletGraph.LabelTemplate>
			<DataTemplate>
				<TextBlock Text="{Binding}" Foreground="Yellow" />
			</DataTemplate>
		</dataVisualization:RadBulletGraph.LabelTemplate>
	</dataVisualization:RadBulletGraph>
</Grid>
The following image shows a BulletGraph with customized labels.
