New to Telerik UI for WinUI? Start a free 30-day trial
Featured Measure
Updated on Mar 26, 2026
The BulletGraph enables you to visualize its featured measure.
Using the Measure
The following example demonstrates how to use the FeaturedMeasure, FeaturedMeasureThickness and FeaturedMeasureBrush properties in order to render the featured measure.
Set the FeaturedMeasure
XAML
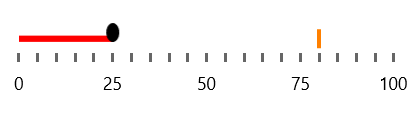
<Grid xmlns:dataVisualization="using:Telerik.UI.Xaml.Controls.DataVisualization">
	<dataVisualization:RadBulletGraph Height="50" Width="300" StartValue="0" EndValue="100" FeaturedMeasure="25"  FeaturedMeasureThickness="5" FeaturedMeasureBrush="Red" />
</Grid>
The following image shows the result.
Customizing the Visual
You can also change the visualization for the end of the featured measure with the help of the FeaturedMeasureAlternativeTemplate property.
Set the FeaturedMeasureAlternativeTemplate
XAML
<Grid xmlns:dataVisualization="using:Telerik.UI.Xaml.Controls.DataVisualization">
	<dataVisualization:RadBulletGraph Height="50" Width="300" StartValue="0" EndValue="100" FeaturedMeasure="25" FeaturedMeasureThickness="5" FeaturedMeasureBrush="Red">
		<dataVisualization:RadBulletGraph.FeaturedMeasureAlternativeTemplate>
			<DataTemplate>
				<Rectangle Width="2" Height="15" Fill="Yellow" />
			</DataTemplate>
		</dataVisualization:RadBulletGraph.FeaturedMeasureAlternativeTemplate>
	</dataVisualization:RadBulletGraph>
</Grid>
The following image shows the result.
