This is a migrated thread and some comments may be shown as answers.

How to draw the chart like this picture?

3 Answers 72 Views
Chart
This is a migrated thread and some comments may be shown as answers.
ABC
Top achievements
Rank 1
ABC asked on 24 Jul 2012, 01:21 AM

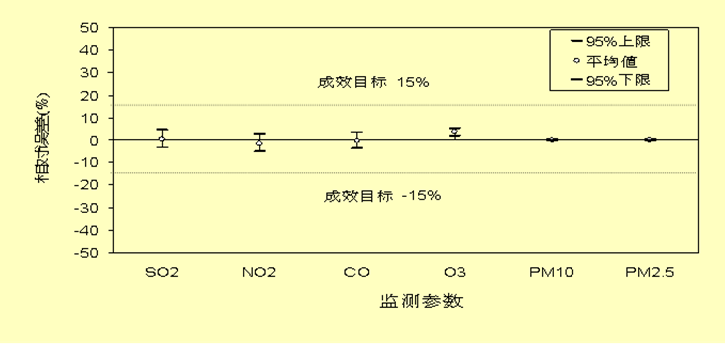
Should I give each kind of gas both 4 series(upper limit,lower limmit,a point called average,and a series which connect average point,lower limit,lower limmit)?

 here is the picture http://www.telerik.com/ClientsFiles/375987_QQ-20120724085854.png

3 Answers, 1 is accepted

Sort by
0
Rosko
Telerik team
answered on 26 Jul 2012, 12:41 PM
Hello,

The best way to achieve the desired chart is to use a combination of two series: CandleStick/Stick and Scatter series. I have attached a project demonstrating this. I hope you will find it usefull.

Regards,
Rosko
the Telerik team

Explore the entire Telerik portfolio by downloading Telerik DevCraft Ultimate.

0
ABC
Top achievements
Rank 1
answered on 26 Jul 2012, 02:05 PM
I try your example,althougt it almostly can draw this , it can not be handle the horizontal length (in the picture bleow,I want to make it start  draw at x=3
and end draw at x=4) it can not do that. Anyway,Thanks.
The picure I try herehttps://www.yousendit.com/download/QlVnT0NjckkxUUJnRXNUQw
0
Rosko
Telerik team
answered on 30 Jul 2012, 07:40 AM
Hi,

What you need to do is to set the ItemWidthPercent property. Its value ranges from 0 to 100.

radChart.DefaultView.ChartArea.ItemWidthPercent = 1;


All the best,
Rosko
the Telerik team

Explore the entire Telerik portfolio by downloading Telerik DevCraft Ultimate.

Tags
Chart
Asked by
ABC
Top achievements
Rank 1
Answers by
Rosko
Telerik team
ABC
Top achievements
Rank 1
Share this question
or