This question is locked. New answers and comments are not allowed.

Hi
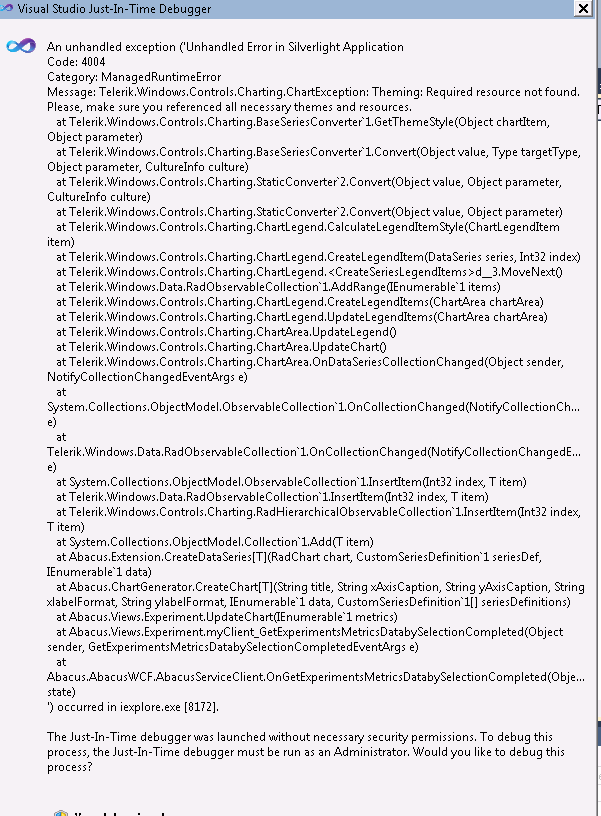
I get exception while trying add point in code behind to dataSeries (see below). What I am doing is :
I wrote a class to customize the chart and try to add dataseries to the same chart ( see below code). I first thought it might not allow to add datapoint after the dataseries has been added to the chartarea, so I commented out the code in the file for adding datapoint and change to add the point to the function which creates the dataSeries, but the same exception occurs. the execption happens at chart.DefaultView.ChartArea.DataSeries.Add(dataSeries);
The caller is like:
RadChart chart = ChartGenerator.CreateChart<ExperimentMetrics>("lineChartMl1", "Validation Date", "RIG", "dd-MMM", null, metrics,
new CustomSeriesDefinition<ExperimentMetrics>("dummy", "Experiment RIG", new LineSeriesDefinition(), a => ChartGenerator.CreatePoint(a.ValidationDateStartTime, a.RigExpt), true),
new CustomSeriesDefinition<ExperimentMetrics>("dummy", "Prod RIG", new LineSeriesDefinition(), a => ChartGenerator.CreatePoint(a.ValidationDateStartTime, a.RigProd), true));
chart.Content = ML1Tab;
using System;
using System.Net;
using System.Windows;
using System.Windows.Controls;
using System.Windows.Documents;
using System.Windows.Ink;
using System.Windows.Input;
using System.Windows.Media;
using System.Windows.Media.Animation;
using System.Windows.Shapes;
using System.Linq;
using System.Collections.Generic;
using Telerik.Windows.Controls.Charting;
using Telerik.Windows.Controls;
namespace Abacus
{
public class CustomSeriesDefinition<T>
{
private string _name = null;
public string Name
{
get { return _name; }
set { _name = string.IsNullOrEmpty(value) ? "(Automatic)" : value; }
}
public SeriesDefinition ChartType { get; set; }
public string LegendLabel { get; set; }
public Func<T, DataPoint> Compute { get; set; }
public bool IsVisableInLegend { get; set; }
public Action<DataSeries> CustomFormatter { get; set; }
public CustomSeriesDefinition(string name, string legendLabel, SeriesDefinition chartType, Func<T, DataPoint> compute, bool isVisableInLegend)
{
Name = name;
ChartType = chartType;
Compute = compute;
IsVisableInLegend = isVisableInLegend;
LegendLabel = legendLabel;
}
}
public class ChartGenerator
{
public static RadChart CreateChart<T>(string title, string xAxisCaption, string yAxisCaption, string xlabelFormat, string ylabelFormat, IEnumerable<T> data, params CustomSeriesDefinition<T>[] seriesDefinitions)
{
if (title == null)
title = "Generated Chart";
var chart = CreatedDefaultChart(title);
if (xAxisCaption != null)
chart.DefaultView.ChartArea.AxisX.Title = xAxisCaption;
if (yAxisCaption != null)
chart.DefaultView.ChartArea.AxisY.Title = yAxisCaption;
if (xlabelFormat != null)
chart.DefaultView.ChartArea.AxisX.DefaultLabelFormat = xlabelFormat;
if (ylabelFormat != null)
chart.DefaultView.ChartArea.AxisY.DefaultLabelFormat = ylabelFormat;
if (seriesDefinitions == null)
return chart;
foreach (var seriesDef in seriesDefinitions)
chart.CreateDataSeries(seriesDef, data);
//foreach (var dataElement in data)
// foreach (var series in seriesDefinitions)
// chart.AddDataSeriesPoint(series, dataElement);
return chart;
}
/// <summary>
/// Create a default RadChart
/// </summary>
/// <param name="title"></param>
/// <returns></returns>
internal static RadChart CreatedDefaultChart(string title)
{
RadChart chart = new RadChart();
chart.Name = title;
return chart;
}
/// <summary>
/// Creates a data point using objects.
/// </summary>
/// <param name="x">The x value</param>
/// <param name="y">The y values</param>
/// <returns>The corresponding datapoint</returns>
public static DataPoint CreatePoint(DateTime? x, double y)
{
var p = new DataPoint() { YValue = y, XValue = x.GetValueOrDefault().ToOADate() };
return p;
}
internal static DataSeries CreateDefaultDataSeries<T>(CustomSeriesDefinition<T> seriesDef)
{
DataSeries dataSeries = new DataSeries();
dataSeries.Definition = seriesDef.ChartType;
return dataSeries;
}
}
public static class Extension
{
/// <summary>
/// Add datapoint to data series
/// </summary>
/// <typeparam name="T"></typeparam>
/// <param name="chart"></param>
/// <param name="seriesDef"></param>
/// <param name="value"></param>
public static void AddDataSeriesPoint<T>(this RadChart chart, CustomSeriesDefinition<T> seriesDef, T value)
{
var point = seriesDef.Compute(value);
if (point != null)
{
for (int i = 0; i < chart.DefaultView.ChartArea.DataSeries.Count; i++)
{
if (chart.DefaultView.ChartArea.DataSeries[i].LegendLabel == seriesDef.LegendLabel)
{
chart.DefaultView.ChartArea.DataSeries[i].Add(point);
}
}
}
}
public static void CreateDataSeries<T>(this RadChart chart, CustomSeriesDefinition<T> seriesDef, IEnumerable<T> data)
{
//if already there, do nothing
if (chart.DefaultView.ChartArea.DataSeries.Any(s => s.LegendLabel == seriesDef.LegendLabel))
return;
var dataSeries = ChartGenerator.CreateDefaultDataSeries(seriesDef);
if (seriesDef.IsVisableInLegend)
dataSeries.LegendLabel = seriesDef.LegendLabel;
foreach (var dataElement in data)
{
var point = seriesDef.Compute(dataElement);
dataSeries.Add(point);
}
chart.DefaultView.ChartArea.DataSeries.Add(dataSeries);
}
}
}
